

What makes MIKAIA® a powerful tool for image analysis is its ability to compute statistics and make comparisons not only between scans, but also within a scan between different regions of interests (ROIs). One key feature, the “Divide by ROIs” option, available in MIKAIA’s analysis apps, allows users to aggregate statistics and gain a clearer understanding of how cell populations differ across various regions of interest. The concept is very generic, but concrete examples include:
- Count positive cells both inside a metastasis and in the surrounding microenvironment
- Calculate immune cell density in the metastasis core, across three bands of inwards and outwards concentric margins, and the remaining area outside of the tumor.
- Analyze IHC staining across TMA cores.
If you’re using MIKAIA® for the first time or if you haven’t explored all its features yet, you might find that the Divide by ROIs option requires a little extra guidance. That’s exactly what this MIKAIA® University app note aims to do: break down the terminology and guide you through the necessary steps to make comparisons within a slide’s image.
Scan areas: Analyzing specimens individually on multi-specimen slides
When glass slides contain multiple specimens (e.g., to save scanning time or when working with Tissue Microarrays, see below), the scan must first be subdivided into scan areas so you can compute statistics for each specimen individually. You can create scan areas either manually or automatically by using the Tissue Detection App.
If you choose to draw scan areas manually, start by creating a special class “Scan Areas” using the option in the annotation classes side panel’s toolbar menu.

Then, draw a rectangle for each scan area, ensuring that the areas do not overlap. For each rectangle, enter a text label that will be used as the scan area name. If you don’t provide a label, the scan areas will be automatically assigned names like ‘Scan Area 1,’ ‘Scan Area 2,’ and so forth.

Once scan areas are created, all image analysis apps that support the “Divide by ROIs” functionality in their configuration panel will be able to collect separate statistics per scan area, provided the “Divide by Scan Areas” option is enabled (see below).
Special case: TMAs
In the case of Tissue Microarrays (TMAs), each TMA core constitutes a scan area. The Tissue Detection App can be configured to automatically create one scan area per TMA Core (see figure below). This way, downstream analysis apps such as the IHC Cell Detection App, the FL Cell Analysis App, or the Annotation Metrics App will automatically compute statistics separately per TMA core.
Please refer to the MIKAIA® manual to learn more about TMA de-arraying options.

Defining and analyzing regions of interest
When preparing slides for analysis, you might not only want to subdivide them into scan areas, but define additional regions of interest (ROIs), e.g., to distinguish a metastasis and the surrounding microenvironment.

In MIKAIA®, you can define ROIs manually (e.g., by arbitrarily drawing a freeform annotation) or automatically by using one of the tissue analysis apps (AI Author, H&E Crypt AI App, or Mask-by-Color App.) The ROIs you or the app define serve as the basis for subsequent cell-analysis.
Ultimately, you can define as many ROIs as necessary and aggregate your analyses using the “Divide by ROIs” analysis option (see below).
As outlined in our Annotation Concepts for Whole-Slide-Images , MIKAIA® models a hierarchy for each ROI class. If you have a slide with two specimens (i.e., two scan areas), the analysis app will group detected cells by both scan area and ROI.
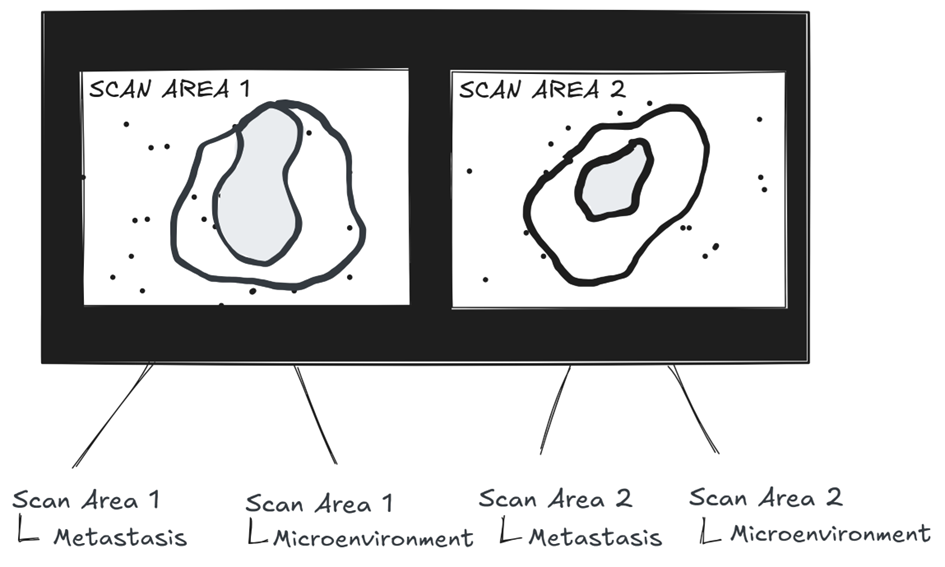
The class “Scan Area 1 | Metastasis”, for example, will include only the cells located within the boundaries of that specific annotation.
Options for analyzing ROIs
Option 1: Analyzing a specific ROI or multiple ROIs
In the analysis configuration panel, you can select the mode “RoI” to analyze a specific region of interest. Alternatively, by selecting multiple annotations, you can analyze several ROIs in a single run.

Option 2: Batch-analyzing ROIs
If you have two or more slides selected in the “Slides” pane, you can choose to analyze the selected slides entirely or by ROI. Make sure to check the selected mode: It should say “RoI: entire slides” right next to the “Batch” button or show the class name of the selected ROI.


In the “General Settings” pane, you can specify which existing annotations (i.e., ROI classes) the app will analyze.

For more complex analyses, the “Divide by ROIs” option will streamline your workflow, allowing you to compile analyses and compare ROIs across a slide.
Divide by ROIs
In downstream analysis apps, the “Divide by ROIs” functionality helps you analyze detected cells by sorting them based on their location in relation to specific regions of interest marked on the slide. (Note that that defining scan areas is not a prerequisite for using the Divide by ROIs feature.)
| Analysis Apps featuring the “Divide by ROIs” functionality |
| IHC Cell Detection App |
| FL Cell Analysis App |
| H&E Cell AI App |
| Mask-by-Color App |
Downstream analysis apps, such as the Cell-Cell-Connections App, Proximity Analysis App, and Cellular Neighborhood App, will recognize that cell types are separated by ROIs and maintain this information when analyzing spatial relationships between objects detected by the above-mentioned apps.
With the “Divide by ROIs” feature, you can easily compare different tissue areas, which streamlines your analysis process. So, how does the “Divide by ROI” fit into your analysis workflow?
Step 1: Define ROIs
Define ROIs either by manually drawing annotations or by creating them automatically using an app, such as the AI Author App or Mask-by-Color App. These tools can generate masks that serve as ROIs for subsequent cell analyses.

- Specify what existing annotation classes shall be interpreted as ROIs. Select these in the “Divide by ROIs” section in the app’s configuration panel (see screenshot above).
- Choose annotation classes: Here, you can select your predefined annotation classes (e.g., “Metastasis”, “Microenvironment”) or click the box to “Toggle All.” Make sure, though, that the selected ROIs do not overlap!
- ROIs “Other”: Once at least one ROI is selected, the ROI “Other” (or “no RoI” or “rest”, depending on the app) will be added automatically (see screenshot below). This means, for example, that when you’re assessing areas solely around a metastasis and not using more fine-grained annotations, you do not need to explicitly include “non-tumor” annotations and the like.
- Enable “Divide by Scan Areas”: By default, the “Divide by Scan Areas” option is enabled allowing the app to collect statistics separately for each scan area.
- ROIs intersecting tissue area: Note that if any of the selected ROIs extend beyond the detected or manually created tissue area, only the intersection between the ROI and the designated “Tissue” class will be included in the analysis.

Step 2: Assign detected cells into separate classes
The app will now assign detected cells into separate classes (by location) and evaluate the statistics individually for each area. In doing so, the app will not create a single class “positive”, for example, but a number of classes denoted as “<ROI name>: positive”, depending on the number of ROIs you selected earlier.

Step 3: Results
The app displays results in both bar diagrams and tables, showing absolute and relative values. You can copy the table by right-clicking and selecting “Copy to Clipboard,” or alternatively, you can export all metrics to a CSV file for downstream analysis using Excel, R, or other tools. The CSV file contains one row per class, along with separate rows for each individual annotation instance within these classes.


Add comment