

The MIKAIA® Cell x Gene App can be used to analyze FISH (or similar, e.g., RNAscope), CISH, or spatial transcriptomics scans, including Xenium by 10x Genomics. For Xenium data in particular, this app is the right choice, supporting three types of analyses:
- Analyze transcriptome and generate diagrams as well as CSV covering various aspects. When one or more ROI classes are selected (optional), the transcriptome statistics will be collected separately per ROI, allowing for a differential type of analyses between ROIs.
- Query subsets of cells that meet specific criteria, such as copy numbers, gene counts, or gene ratio (see below).
- Cell typing (unsupervised cell typing) based on enclosed genes.
Example: Human pancreas
Source: https://www.10xgenomics.com/datasets
In the example below, the tissue area to the right is manually outlined and assigned to a class “My ROI” (shown as a pink outline in the screenshot below). This ROI class is then selected in the Cell x Gene App’s “Divide by ROI” section. As a result, all subsequent analyses aggregate and report results by ROI.
The Divide-by-ROI concept is supported across all MIKAIA® apps and is explained in more detail in our MIKAIA® University appnote Analyzing and Comparing Regions of Interest – “Divide by ROIs” Special.

H&E-guided Xenium analysis
Instead of manually drawing ROIs directly in the Xenium morphology image, ROIs can also be derived using an H&E scan as an orientation. This workflow presents a top-down approach, where the scan is divided into ROIs based on morphology and the transcritpome is then compared across ROIs. By contrast, a bottom-up approach starts with the transcriptome analysis and then uses the result to derive ROIs.
MIKAIA® Slide Align can be used to align a H&E scan with a Xenium scan. In fact, the screenshot above shows such a registered slide. The blue “DAPI” and pink “HE” channel-buttons in the toolbar can be used to switch between the two layers. The Classification AI Author can be used to automatically delineate morphology-defined regions, such as tumor areas, necrosis, inflamed areas, connective tissue, mucosa, etc. These masks found via AI analysis can then be selected in the Cell x Gene App’s “Divide by ROI” section.
Xenium analysis diagrams
Regardless of the type of analysis carried out by the Cell x Gene App, a few overview diagrams are always shown in the result panel’s “Overview” tab.
First, the Cells histogram diagram (below) only shows the distribution of cell abundance per cell type and ROI. In this example, cells were untyped.

The Transcripts histogram vertical bar chart (below) shows the abundance of transcripts, ignoring (at this point) the division into ROIs.

Transcriptome statistics of multiple ROIs within a Xenium scan (2D Heatmap)

The 2D heatmap above shows the top 25 genes, aggregated by ROI, for the following metrics:
- % transcripts in this ROI
- Mean copies / cell
- Max copies / cell
- # copies
- # cells (that contain at least one copy of this gene)
- % transcripts inside cells
- Spots / mm²
- Cells / mm² (only cells that contain at least one copy of this gene)
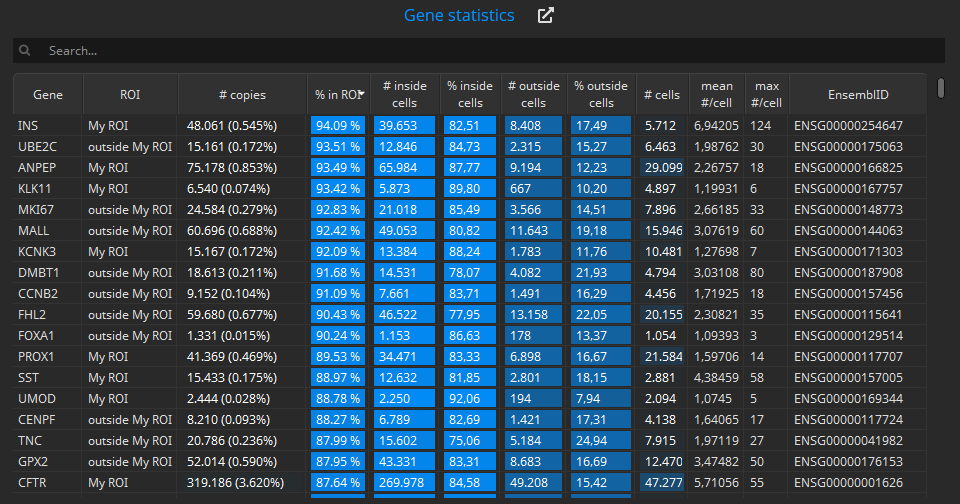
The Gene statistics table below shows the same data in one row per gene and ROI:
Unsupervised cell typing based on enclosed genes
In this example, the same Xenium scan is loaded, and cells are typed by unsupervised clustering based on the contained genes. Here, we chose to cluster cells into 7 types.


Results concerning the unsupervised-clustering-based cell typing are grouped in the result panel’s “Clustering” tab.
The 2D heatmap (left) shows the Cluster defining genes.
On the x-axis, it shows the identified cell types. The rows represent the top expressed genes, measured by average number of copies per cell.

The Cells in feature space scatter plot shows a 2D projection of the clustered cells. It is possible to select between t-SNE, UMAP, or PCA; the number of iterations can be defined as well. The scatter plot is animated so that the user can choose to abort the algorithm once clusters become visible.
Hovering over the plot reveals the play, menu, and undock controls. The play button starts an animation in which each cell moves between its 2D feature space position and its original xy-spatial position.
Configuration options
This section shows the available configuration options in more detail. They enable different types of Xenium analysis.
Select cells by specific copy numbers
Up to five genes can be selected, and for each gene, the minimum and/or maximum copy number can be defined. The query selects all cells that meet ALL criteria.

Select cells by gene types
Classifies cells based on the number of genes (not copy numbers) that are enclosed. Cells can be assigned into two or more classes, where each class is specified by the minimum and maximum number of genes.

Select cells by total copy numbers
Classifies cells based on the abundance of enclosed copies (irrespective of gene).

Select cells by gene ratio
Classifies cells based on the ratio of two selected genes.


Add comment