
This MIKAIA® University app note illustrates how to interactively train a new H&E segmentation AI with serial sections, without having to annotate tumor regions. Instead, an IHC epithelial marker (pan-cytokeratin AE1/AE3) is thresholded through H-DAB stain unmixing to generate highly accurate tumor masks. These masks serve as training annotations in the Segmentation AI Author app to train the H&E AI.
Dataset: Serial sections of vulvar cancer, kindly provided by Universitätsklinikum Erlangen.
Markers: H&E + 7x IHC (AE1/AE3 PCK, CD3, CD4, CD8, CD68, CD163, FoxP3).
Step 1: Align serial sections with MIKAIA® Slide Align
The MIKAIA® Slide Align module is designed to co-align the serial sections from each case. The output is a deformed whole-slide-image (in SVS or OME-TIF format) per stain. Aligned sections from a case are linked together through a companion file (*.multifile.csv), which can be opened directly in MIKAIA®.

Step 2: Open aligned serial section stack in MIKAIA®
The screenshot below shows an H&E image, with toolbar buttons for selecting other brightfield layers visible, similar to a multiplex IHC scan. However, since each layer is brightfield, only one layer is displayed at a time, and they are not mixed together.

The individual aligned slides can also be opened directly and viewed side-by-side. o synchronize the viewers, enable the sync button in the bottom toolbar (indicated by the blue button). When the mouse hovers over the master viewer, the mouse pointer is mirrored in the other viewers.

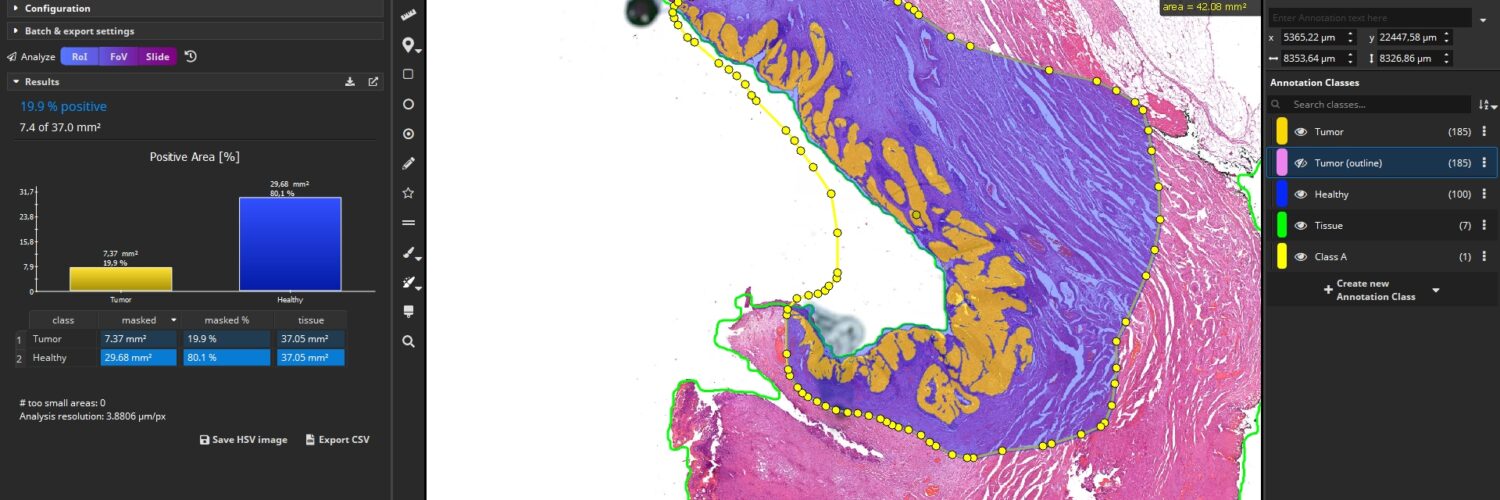
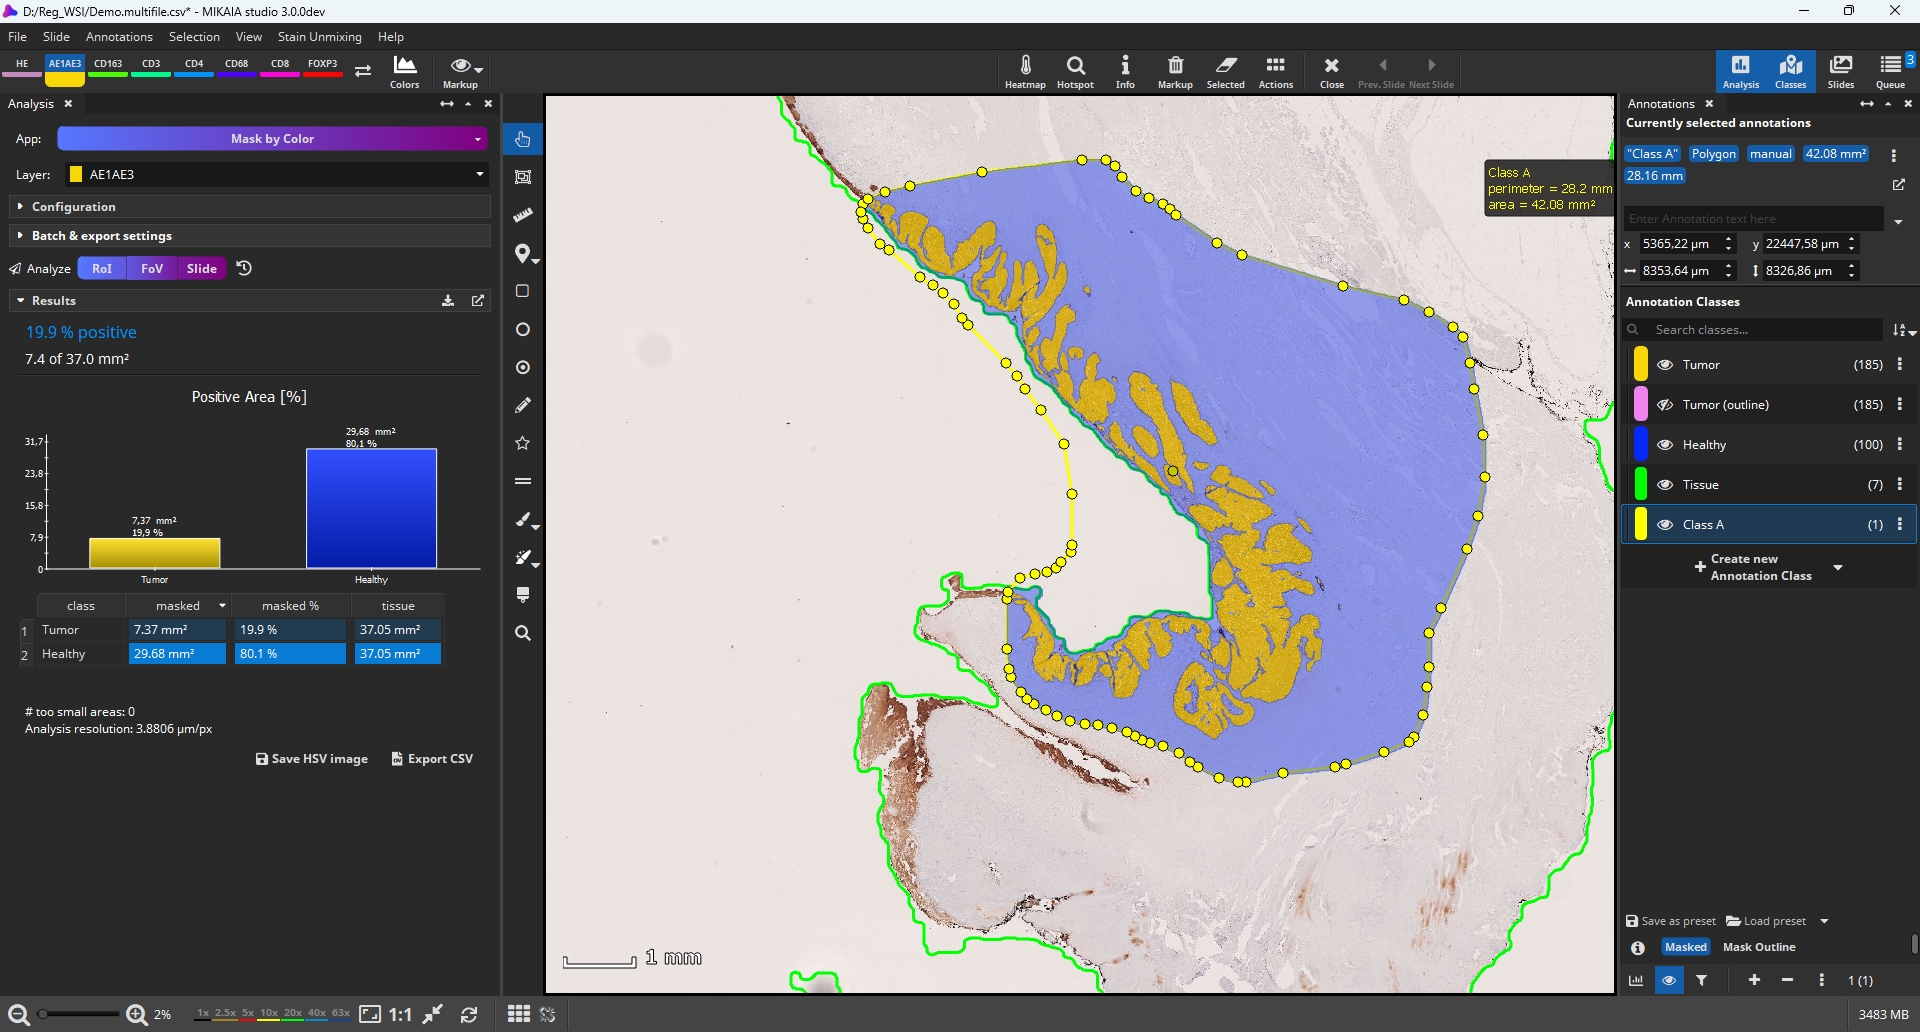
Step 3: Mask DAB+ (brown) regions in IHC tumor marker (PCK)
To train the H&E tumor segmentation AI, only the H&E and the Pan-Cytokeratin AE1/AE3 layers are used in the following steps. The Mask by Color App is employed to accuarately and automatically mask brown tumor regions, as shown in the screenshots below. This app offers various masking modes; in this case, it is configured to deconvolute the hematoxylin and DAB stains and then mask only the DAB stain through thresholding.

Step 4: Train new H&E AI with Segmentation AI Author, using the DAB masks as ground truth
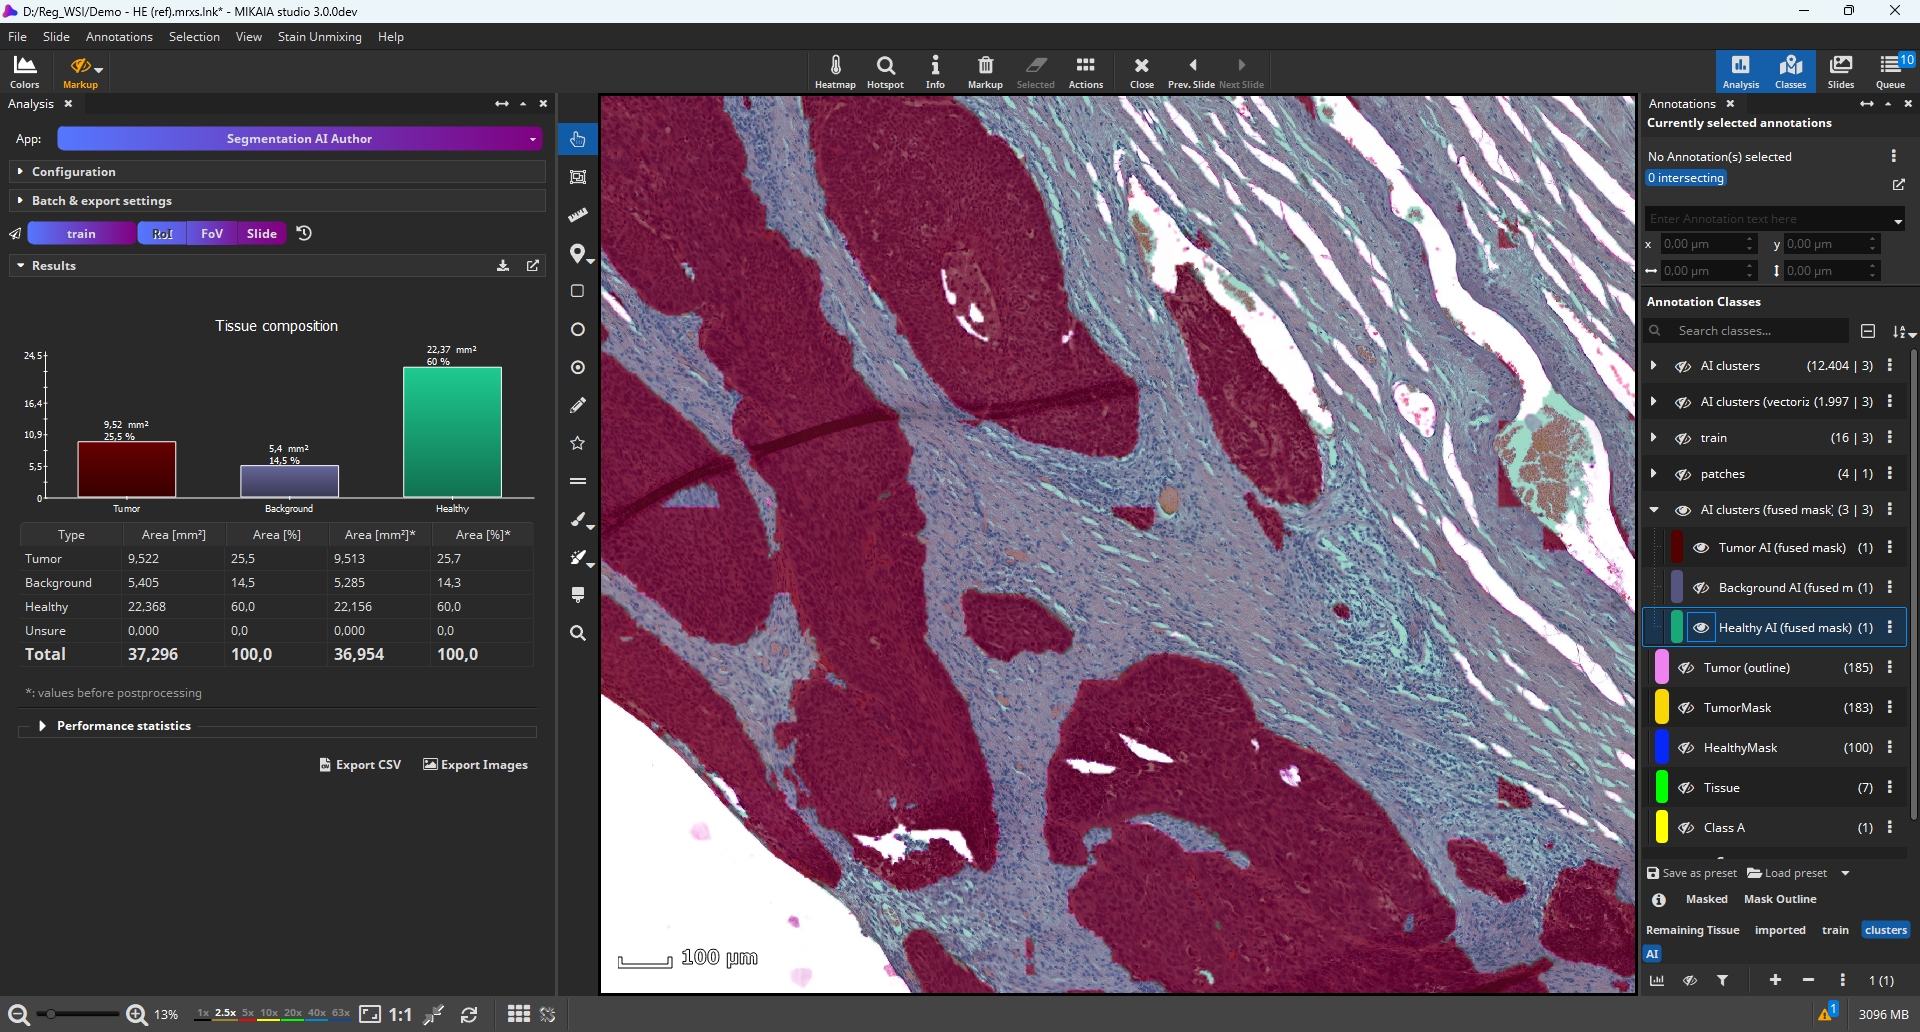
The masks generated from the PCK IHC layer can now be applied to the H&E layer. In the following screenshot, the annotations remain visible while the viewer shows the H&E layer. This approach allows for the training of an H&E segmentation AI using serial sections.s.
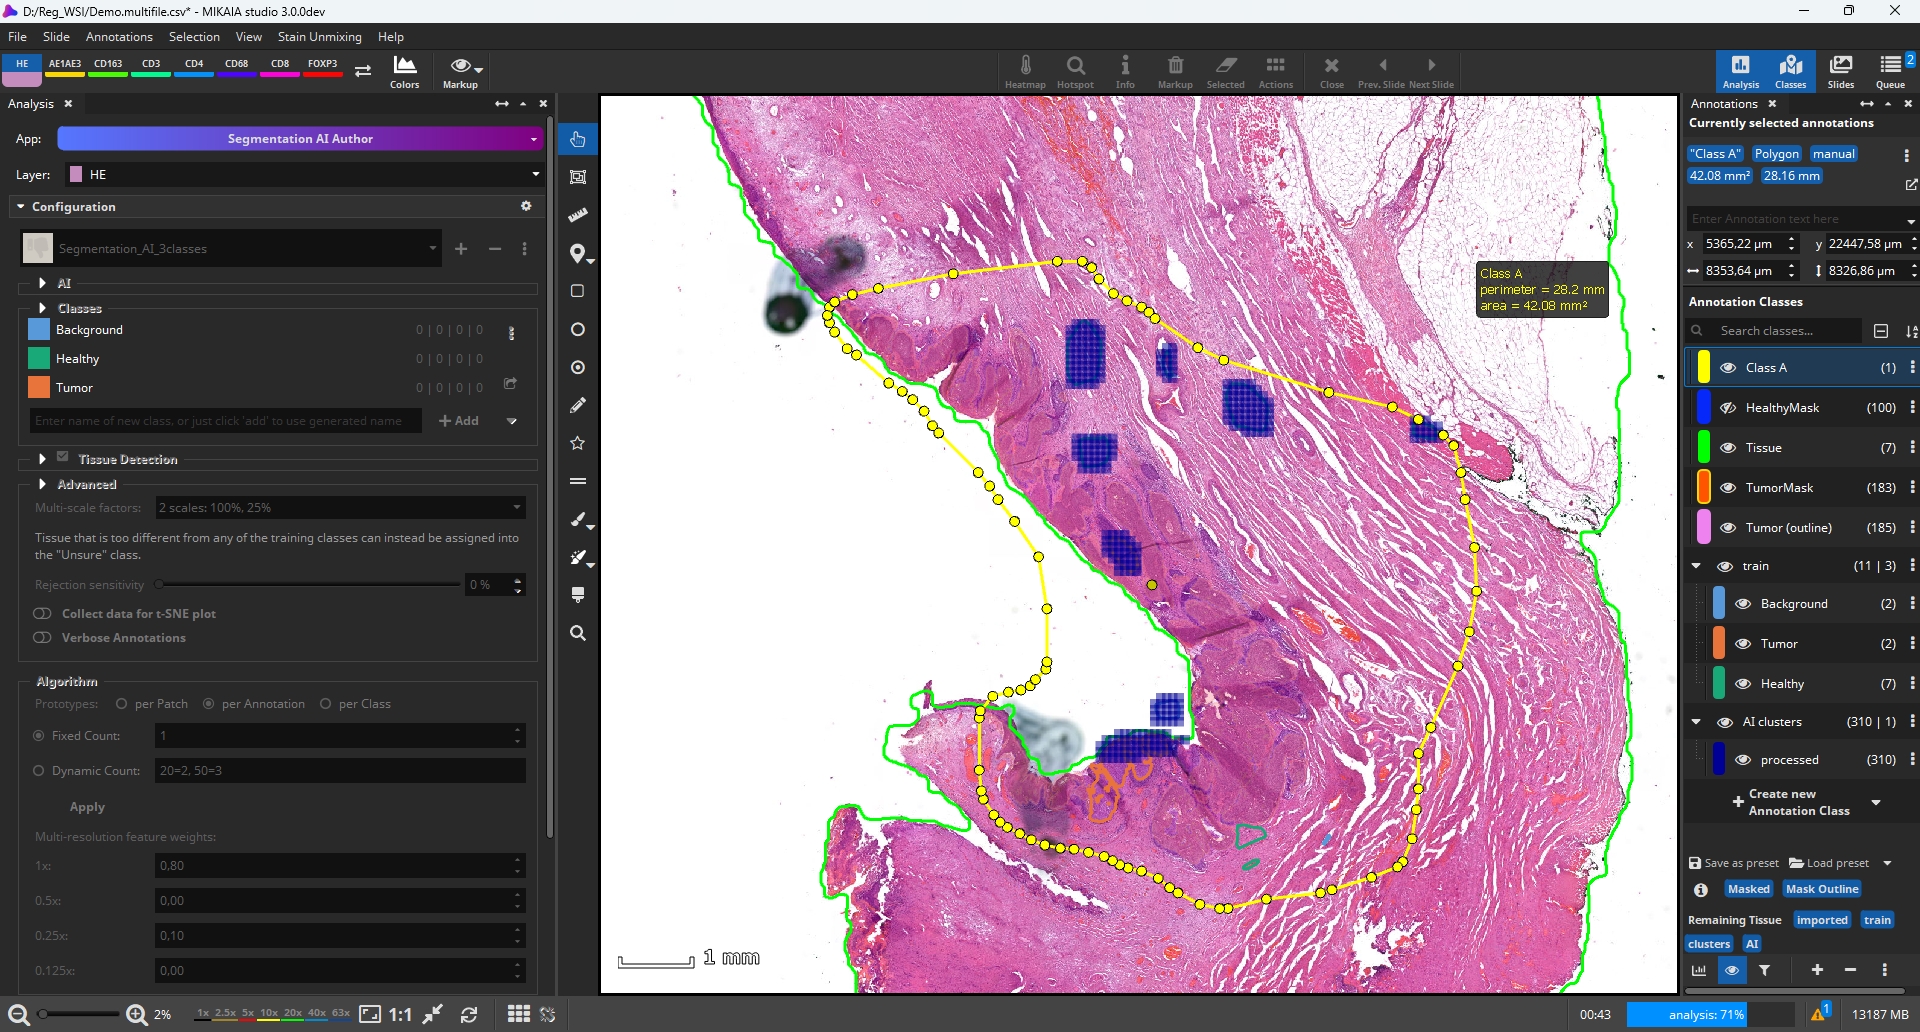
In the Segmentation AI Author App, a new model can now be created by adding three tissue classes: “Tumor”, “Healthy”, and “Background”. Instead of manualy annotating various tumor regions, we now use the PCK mask. Since the Segmentation AI Author App employs Few Shot Learning (“few shots” meaning few training annotations) and to limit the training duration, we select only a subset of the generated PCK masks that captur the tumor’s heterogeneity, discarding large portions of the mask that would not provide any additional training value anyway.
Additionally, we quickly outline a few non-tumor tissue regions as well as white background regions. Then, we click “Train”. The screenshot shows how the training annotations are analyzed tile by tile in order to derive and store a representation of each annotated tissue class. This step only takes approximately one minute, depending on the number and size of annotations.
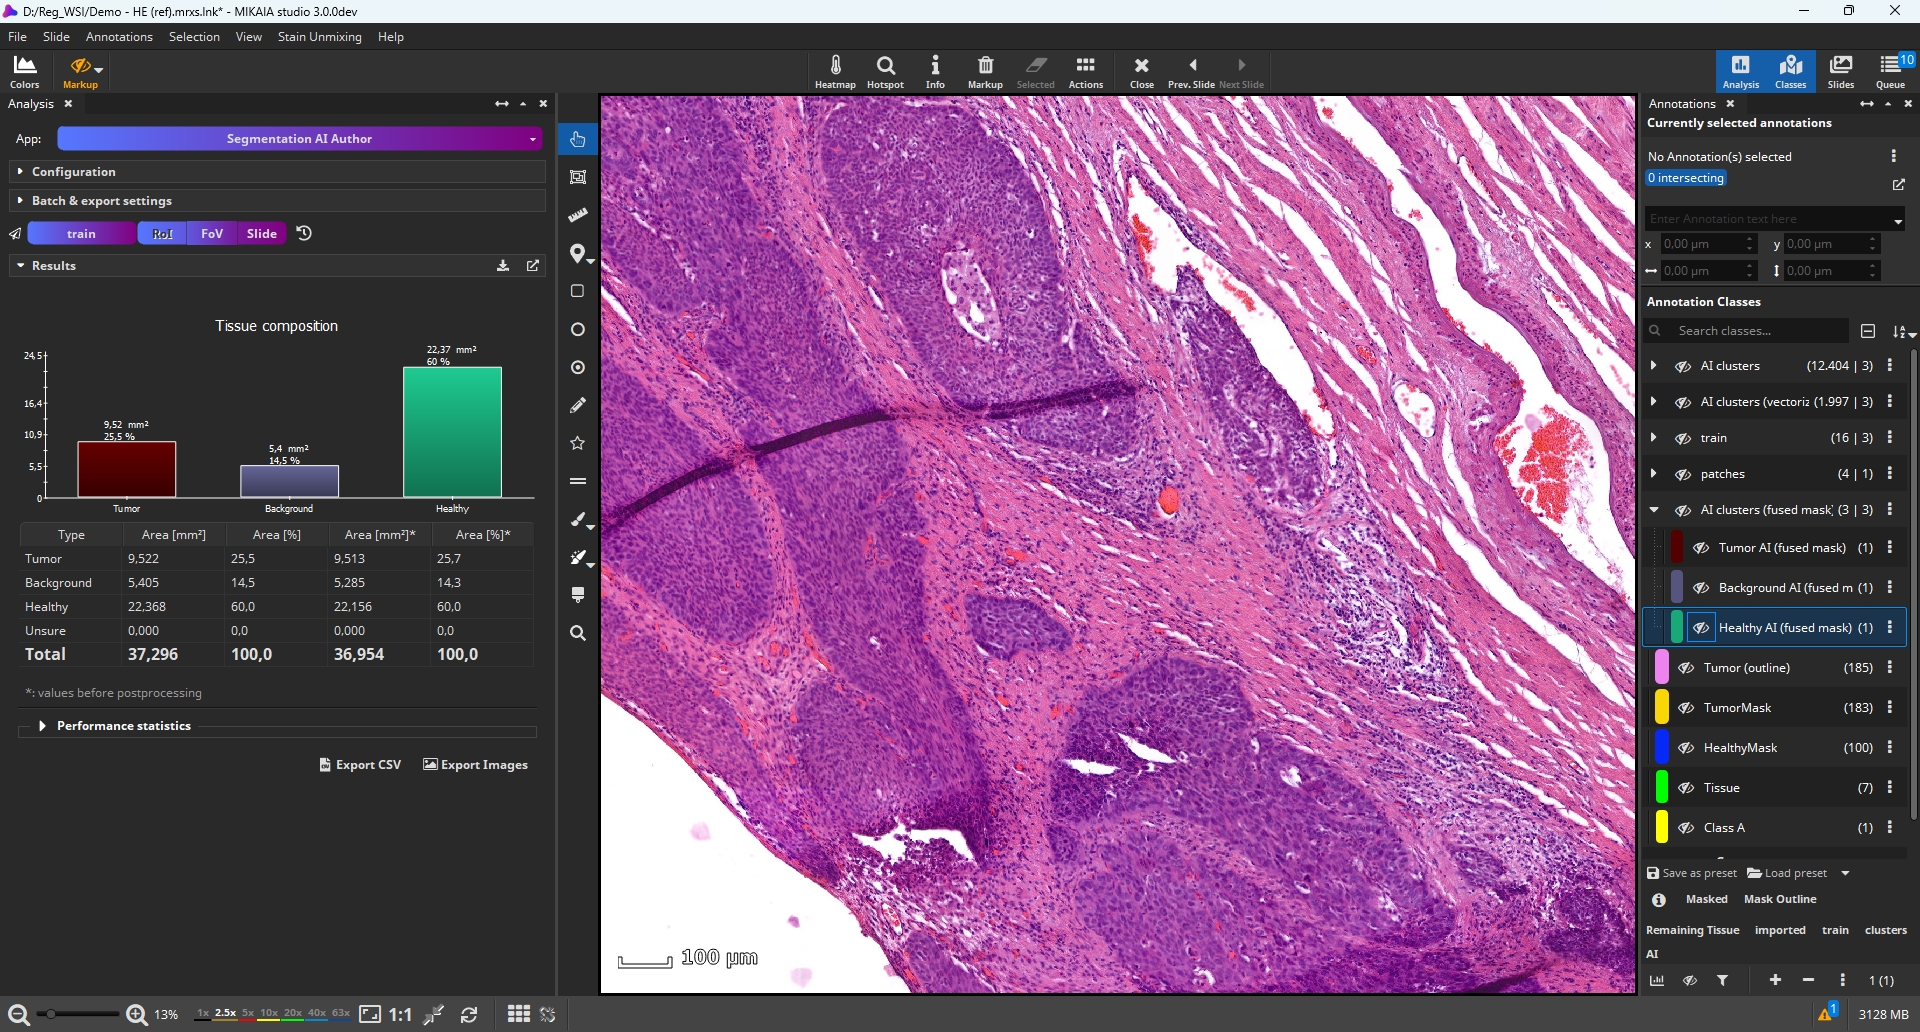
Step 5: Use newly trained AI to analyze further H&E-only scans
The new Vulvar Cancer Segmentation AI, quickly created using the Segmentation AI Author, is now ready for application to additional H&E-scans. The aligned IHC layer is no longer needed. Below is the segmentation for a field of view:
Step 6: Quantify immune landscape in tumor-micro-environment (TME, including video)
Now that the tumor has been masked, it is also possible to quantify the immune landscape. The Universal IHC Cell AI App is used to detect cells in each IHC layer, measure the H & DAB stain expression per cell, and classify them as negative or positive (or grade them based on the DAB expression). In a standard single layer IHC scan, the app categorizes cells as “positive” or “negative”. In a multi-layer stack, however, the app automatically uses the stain names for classification.
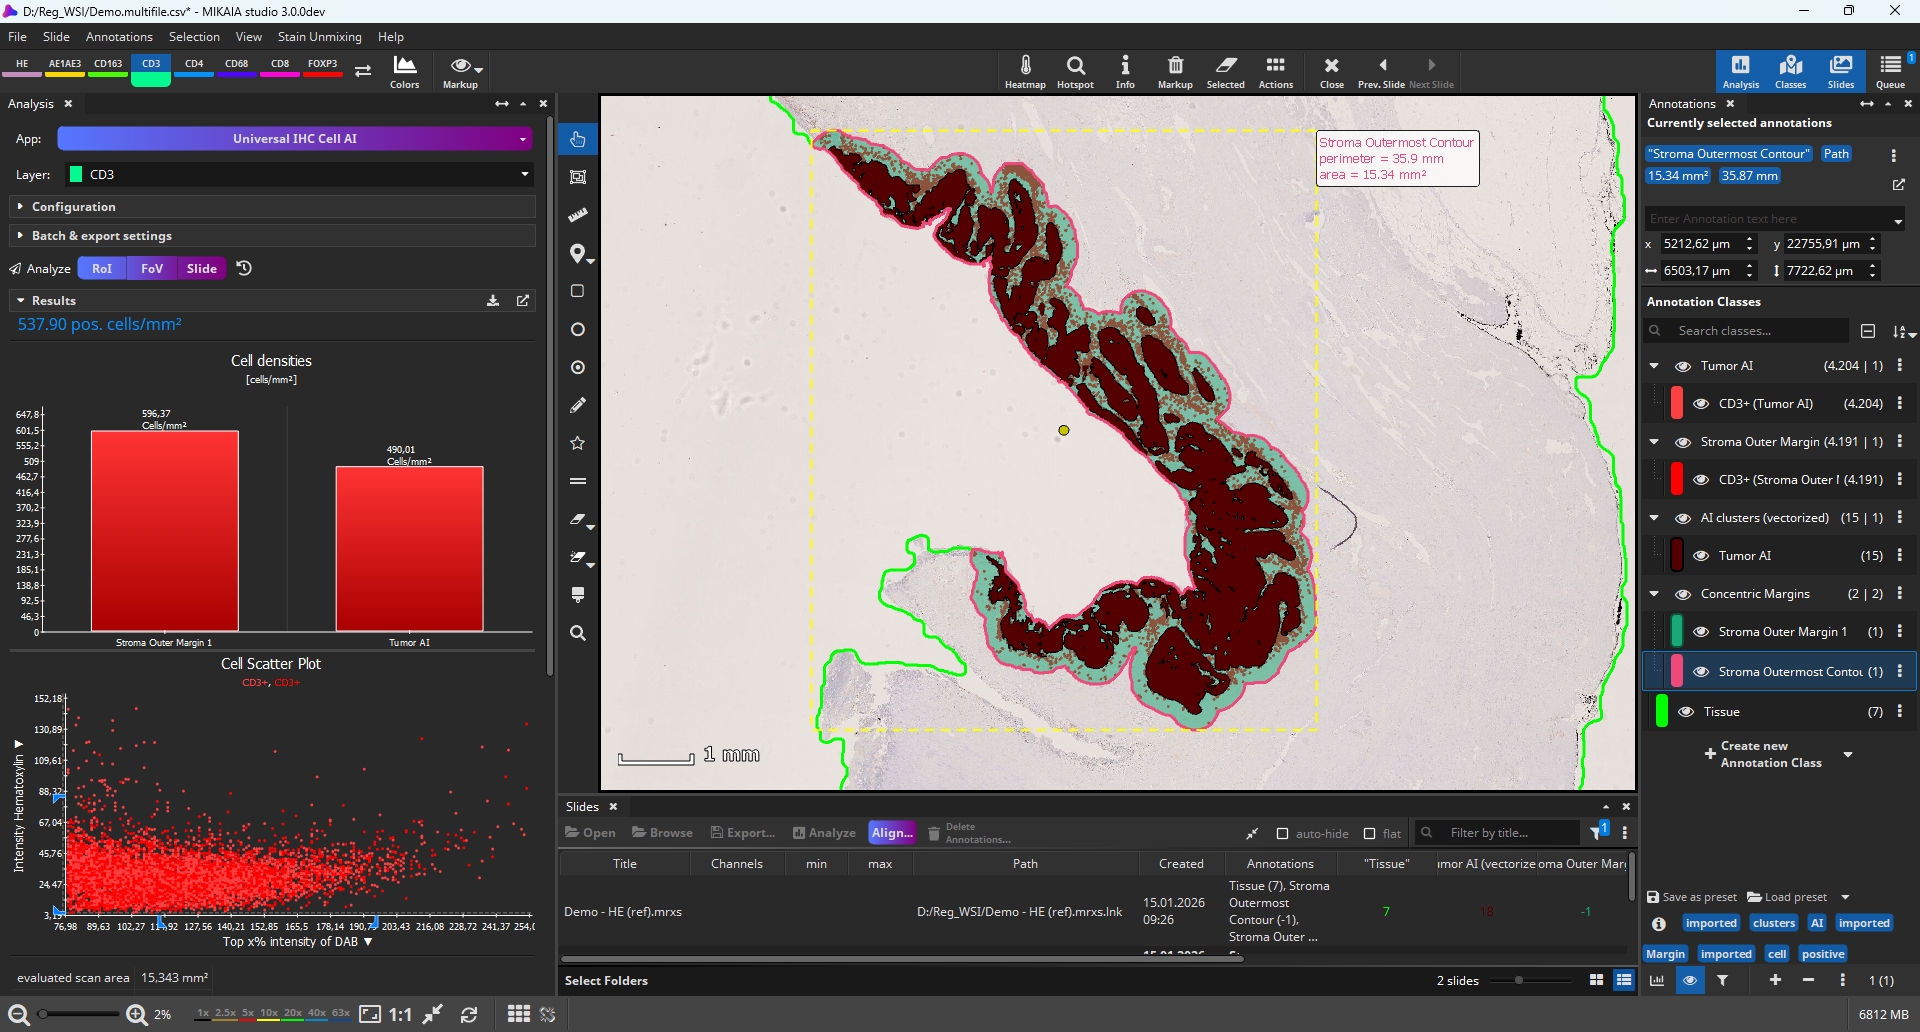
The “Add concentric margins” option (toolbar | Actions) is used to mask the tumor margin by dilating the tumor masks. In the screenshot below, the tumor is highlighted in red, while the margin appears in green. We have renamed the “outer margin” to “Stroma”.
The “Add concentric margins” option creates an “outermost contour” class that includes the outlines containing both the margin and the tumor. We select this contour and click the “Analyze ROI ” button to limit the cell quantification to only this region of interest. We configure the app to only show positive cells, and select the “Tumor” and “Stroma” classes in the “Divide by ROI” section to group detected cells accordingly. After analyzing all IHC layers, the following additional annotation classes are generated: “PCK+ (tumor)”, PCK+ (stroma), “CD3+ (tumor)”, “CD3+ (stroma), and more.
Step 7: Cellular neighborhood analysis
The Cellular Neighborhood App quantifies the cell composition of the cells’ neighborhood for each cell type. Specifically, it iterates over all cells within the selected cell classes. For each cell, it counts the cell types in the cell’s vicinity (k nearest neighbor and/or within a specified radius). These neighborhood composition vectors are then averaged per cell type and categorized by distance.

As a result, for any given cell type, a diagram shows the average cell type composition within 0-10 µm radius, within 10-20 µm, etc. These distance histograms can be viewed side by side per analyzed cell type (screenshot below). Additionally, all data including per-cell-type statistics and even per-cell statistics can be exported to a CSV spreadsheet for a more elaborate downstream analysis outside of MIKAIA®.

Contributors & partners
- Institute of Pathology, Erlangen University Hospital, Comprehensive Cancer Center Erlangen–European Metropolitan Area of Nuremberg (CCC ER-EMN), Bavarian Cancer Research Center (BZKF), Friedrich-Alexander-Universität Erlangen-Nürnberg, Krankenhausstrasse 8–10, 91054 Erlangen, Germany
- Department of Gynecology and Obstetrics, Erlangen University Hospital, Comprehensive Cancer Center Erlangen–European Metropolitan Area of Nuremberg (CCC ER-EMN), Bavarian Cancer Research Center (BZKF), Erlangen, Friedrich-Alexander-Universität Erlangen-Nürnberg, Universitaetsstrasse 21–23, 91054 Erlangen, Germany
Funding
This MIKAIA® extension has been kindly made possible thanks to venture capital provided by the Fraunhofer Future Foundation (Fraunhofer Zukunfsstiftung). Project: “Histology AI Author”, consortium: Fraunhofer IIS & Fraunhofer MEVIS.


Add comment