

 Volker Bruns
The collaboration aims to show how researchers can use VisiOmics image data within MIKAIA® workflows for cell segmentation, phenotyping, and spatial analysis. This work supports greater flexibility in downstream analysis, helping laboratories connect automated tissue imaging with tools suited to their research questions.
Stockholm, Sweden, 14 September 2026 : MGI Launches VisiOmics in Europe and Unveils AI-Enabled Pathology Portfolio at ECP 2026
MGI’s VisiOmics (PMIF-20RS) integrates fully automated multiplex immunofluorescence staining and imaging, enabling the measurement of more than 20 protein markers within a single tissue section while preserving their spatial context. This application note demonstrates the analysis of a tonsil dataset generated using VisiOmics and analysed with MIKAIA® studio. The tissue was stained for 20 protein markers and one nuclear marker. The analysis included cell segmentation, marker-based phenotyping, and spatial neighbourhood analysis.
MIKAIA® studio 3 natively supports datasets generated with MGI’s fully automated multiplex immunofluorescence staining and imaging system, VisiOmics (PMIF-20RS). This example illustrates how VisiOmics image data can be incorporated into a third-party analysis workflow to investigate cellular composition and tissue organisation.

Overview: MGI VisiOmics 20-plex protein markers + 1 nuclear marker scan of tonsil displayed in MIKAIA® studio (open in new tab)


AI Cell Segmentation of Nuclei and Cell Contour
After tissue detection (see green outline in screenshot above), the next step is to run cell segmentation and cell typing using MIKAIA® FL Cell AI / FISH App.

For cell segmentation, MIKAIA® offers two AI cell segmentation models (CellPose 2 or CellPose-SAM) that can be used out of the box. Since here multiple cytoplasmic and membranous markers are available, the “membrane+nuclear” option can be used so that the AI delineates true cell outlines. We select a few non-nuclear markers for membrane segmentation; as soon as one of them is present in a cell, it will be picked up by the AI. (Alternatively, it is also possible to segment nuclei and then dilate nuclei contours by a fixed radius, e.g., 3µm).
LLM-aided Cell Typing based on Protein Co-expression
Cell typing can be done either by unsupervised clustering or based on co-expression. The slide’s high plexity requires that explicit rules – called a Cell Type Mapping in MIKAIA® – are configured for the used panel. The mapping is stored locally and can be re-used for further slides stained in the same panel.
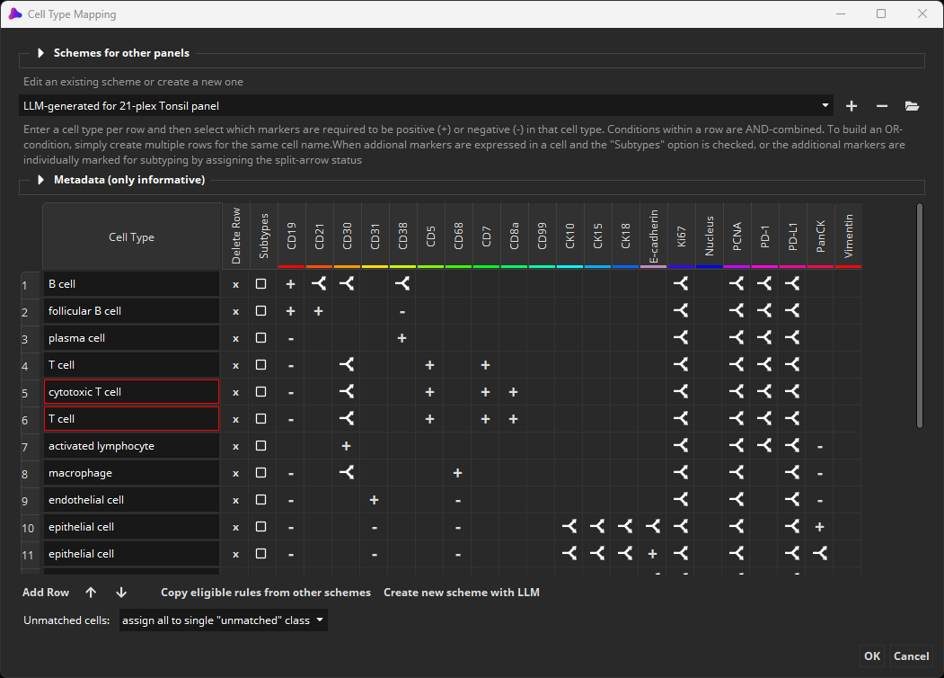
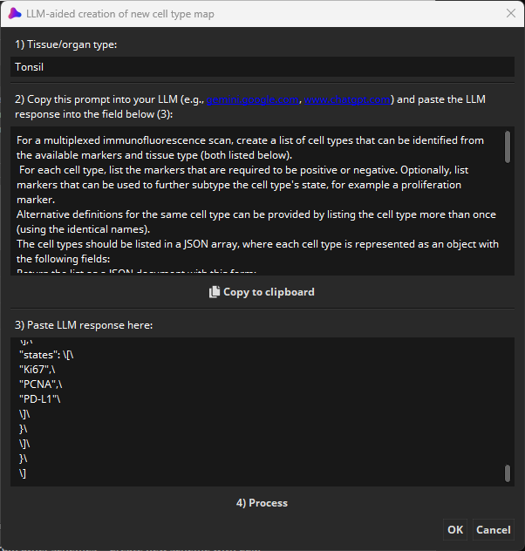
Cell types can be manually configured, but MIKAIA® 3.1 includes a new option: “Create new scheme with LLM”. A dialog shows up, where the user only enters the tissue type (here: “tonsil”) and then an LLM prompt is automatically generated that instructs the LLM to create a cell type mapping based on the available markers. Simply copy and paste the prompt into any LLM, copy and paste the LLM’s answer back into the dialog, and press “Process”. We tested this with ChatGPT and Gemini. The created cell type mapping can then still be manually altered, so this option serves as a good starting point.
In order to decide for each cell which markers are positive and which are negative, their expression is measured and compared against a marker-specific threshold. Here, we used automatic thresholding. The whole-slide analysis takes between a few minutes up to an hour (depending on available GPU, selected AI model and number, and plexity). Here, ca 65k cells were detected, the nucleus and contour delineated, and all markers’ expression measured for both cell compartments. Cells are classified based on the above cell type mapping.
 Interactive density heatmap tool illustrates hotspots of cells of type "B cell germinal center" (open in new tab)


Export of cell coordinates and protein expression for downstream analysis
MIKAIA® by default generates a CSV spreadsheet that contains statistics per cell type, but also marker expressions per cell. Cell coordinates can be exported to geojson, XML, CSV, or, alternatively, a label map can be generated using the Tile Export App. In an upcoming update, a html report will be generated additionally and cell coordinates including marker expressions will always be stored in hdf5.
These various convenient ways of exporting analysis results enable downstream tasks, such as more advanced neighbor analyses or Deep Visual Proteomics, where cells or ROIs are physically collected using laser-capture-microdissection and then undergo high-resolution mass spectroscopy.
Cellular Neighborhood Analysis in MGI VisiOmics Scans

The MIKAIA® Cellular Neighborhood App collects the cell composition in the neighborhood of each cell. The neighborhood can be defined using a radius (e.g., 100 µm), the k-nearest neighbors, or a combination of both. The app then computes neighborhood statistics per cell type and also breaks them down into a distance histogram. Furthermore, it uses the neighborhood compositions for identifying cellular neighborhoods (CNs) and then assigns each cell to a one such CN. The “Cluster Explorer” 2D heatmap informs per CN type, which cell types have a high or low occurrence.
Cell Type Proximity Analysis
The MIKAIA® Proximity Analysis App can be used to measure proximities between two sets of cell types. In the screenshot below, the cell type “Epithelial cells general” was selected as the source type, and “Basal epithelium” as the target type. The viewer is configured to show only the two cell types as well as the “shortest paths” annotations that were generated by the Proximity Analysis App to visualize the results. A distance histogram shows in bins of 20 µm (configurable) what percentage of source cells have a target cell within the distance represented by the histogram bin.

MIKAIA® Proximity Analysis App illustrated proximity of two cell types: "Epithelial cells general" and "Basal epithelium". Image layer is hidden (open in new tab)


Interrogate Spatial Heterogeneity of Cell Types
The MIKAIA® Grid Analysis App allows to overlay a virtual grid, collect statistics per grid tile, and then grade grid tiles. Here, we use the absolute abundance of a selected cell type (“B cell germinal center”) as a metric and configure a grading scheme of 6 grades ranging from none/very few (grade 1) to many (grade 6) cells per tile. The exact cutoffs can be interactively configured. Additionally, a histogram illustrates number of tiles by target cell type abundance. The screenshot nicely shows that the “B cell germinal center” cell type has high occurrence inside germinal centers and very low / no occurrence outside.

Investigate Spatial Clustering of specific Cell Types
The Spatial Clustering App can group selected cell types into spatial clusters. When two target cell types are located within a user-defined distance (e.g., 30µm), they are grouped into the same cluster. The cluster is grown until no more target cell is within the given distance of the cluster’s outermost cells. Additionally, a minimum cell count per cluster can be defined in order to avoid that many small clusters are generated. Cluster outlines are generated as yellow annotations, and a histogram informs whether the cell type builds few large clusters (“cells tend to occur in the same place”) or many small clusters or now clusters at all (“cells tend to stay away from each other”)



Add comment