
Tumor cells dynamically interact with their microenvironment to stimulate cancer development, progression, and metastasis. To understand the biology of the tumor-immune interactions, it is essential to identify tumoral, immune, and non-immune cell types and their spatial distribution. Cells can be more or less equally distributed across the tissue or assume a very compartmentalized organization. In order to quantify spatial clustering of cell types we make distinct tools available in the MIKAIA® software. In this MIKAIA® University application note, we demonstrate how spatial cell clustering can be analyzed with the help of the MIKAIA Spatial Clustering App and the IHC Cell Detection App.
What do we mean by Spatial Clustering?
By spatial clustering we mean that adjacent cells are grouped into a cluster. The cluster definition is configured by the user and only comprises two numbers: the maximum distance of two cells that belong to the same cluster (in µm) and the minimum number of cells in a single cluster. The algorithm is easily explained: It starts at one cell (cluster size = 1) and checks in its near vicinity (radius = distance threshold) if another cell is present. If that is the case, the cell is added to the same cluster and the search for further nearby cells begins again. This continues until all cells have been assigned to a cluster. Subsequently, clusters that contain less than the required amount of cells are removed.
Detection of positive cells
First, select the IHC Cell Detection App to detect positive cells in the outlined tissue, e.g., in this example FoxP3+ T-cells in an IHC-stained lung section. As FoxP3+ cells present as small, relatively dark solidly filled cells in the DAB channel, the IHC Cell Detection App’s “marker mode” is best suited, as it directly detects cells in the unmixed DAB channel. Next, the sensitivity for counting detected cells as “positive” is adjusted. To this end, it is helpful to temporarily enable that negative cells are displayed as well, in order to find the best positivity threshold. Afterwards, parameters and settings can be stored by creating a new configuration preset. We call it “FoxP3 lung”.

Search for Clusters by use of the IHC Cell Detection App
In the next step, we would like to define specific cell clusters and their spatial localization in the “FoxP3 lung”. Cell Clusters can be directly determined in a post-processing step in the IHC Cell Detection App. Therefore, enable the “Group into Clusters” button and adjust cluster setting according to your needs. The app outlines each cluster and reports the number of objects contained in each cluster in the annotation text. Cluster analysis can be done for single ROIs, an entire slide, or an entire dataset (Batch analysis).

The Results pane shows cell density in cells/mm2 and detected cells are visualized in a scatter plot. Additionally, a table displays the number of clusters and amount of cells within each cluster. Results can easily be exported into a CSV file that can be opened by Microsoft Excel.

Search for Clusters by use of the Spatial Clustering App
If cluster settings are not clear at the beginning or you would like to try out different settings, cluster analysis can also be performed in the Spatial Clustering App. First, detect positive cells without enabling the “Group into Clusters” button in the IHC Cell Detection as described previously. Save the settings as a preset and switch to the Spatial Clustering App. Then, select the annotation classes that contain the objects which shall be clustered, e.g., the FoxP3+ T-cells, and adjust the cluster definition settings as you need them. The Spatial Clustering App then groups cells or other annotation objects into clusters. The clustering only takes a few seconds, even for thousands of cells. The app outlines each cluster and reports the number of contained objects. Two adjacent cells are grouped into a cluster when their distance is less than the user-defined threshold (in µm). Additionally, a minimum number of objects per cluster can be required.
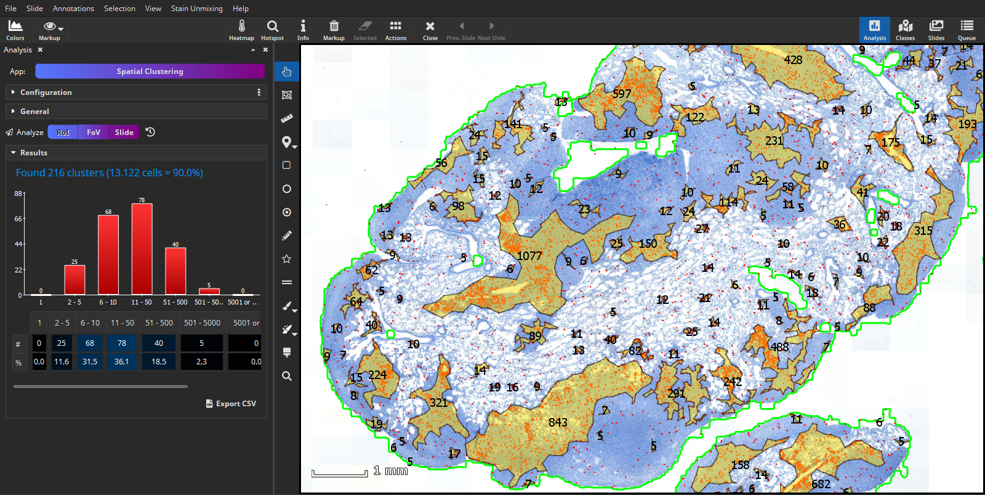
The Results pane shows a bar chart that visualizes the number of clusters and amount of cells within each cluster. These quantitative results can easily be exported into a CSV file that can be opened by Microsoft Excel.

Alternative Analysis: Hotspots search
An alternative post-processing algorithm that follows a cell detection is the hotspot search. One or multiple hotspots can be sought after the cell analysis has been carried out. Hotspots can be determined in a post-processing step in the IHC Cell Detection App. Alternatively, it can be started at any time via the “Hotspot” Button in the main toolbar. This feature automatically locates a circular hotspot of a user-defined diameter (e.g., 1000 µm) that contains the highest number of cells in any of the enabled annotation classes. The hotspot is always circular. It is possible to display the top N hotspots (“# Hotspots”) or all hotspots containing at least N cells (“Min. # per Hotspots”). These constraints can be applied individually or in combination. A cell will only ever be counted towards a single hotspot even if two hotspots overlap. The number of annotations contained in the hotspot is indicated by the annotation text of the hotspot.


Add comment