
In this MIKAIA University application note, we guide you through the analysis of a common use case, coexpression of marker combinations in islets of Langerhans and surrounding tissue in a pancreas 4plex imaged with NanoString GeoMx DSP.
Coexpression analysis in islets of Langerhans
The human pancreas is a complex organ consisting of exocrine cells and a mixed population of endocrine cells called islets of Langerhans. These micro-organs have been much studied in the context of diabetes due to the hormones produced and secreted from the endocrine cells (Xavier et al., 2018; Docherty & Russ, 2019).
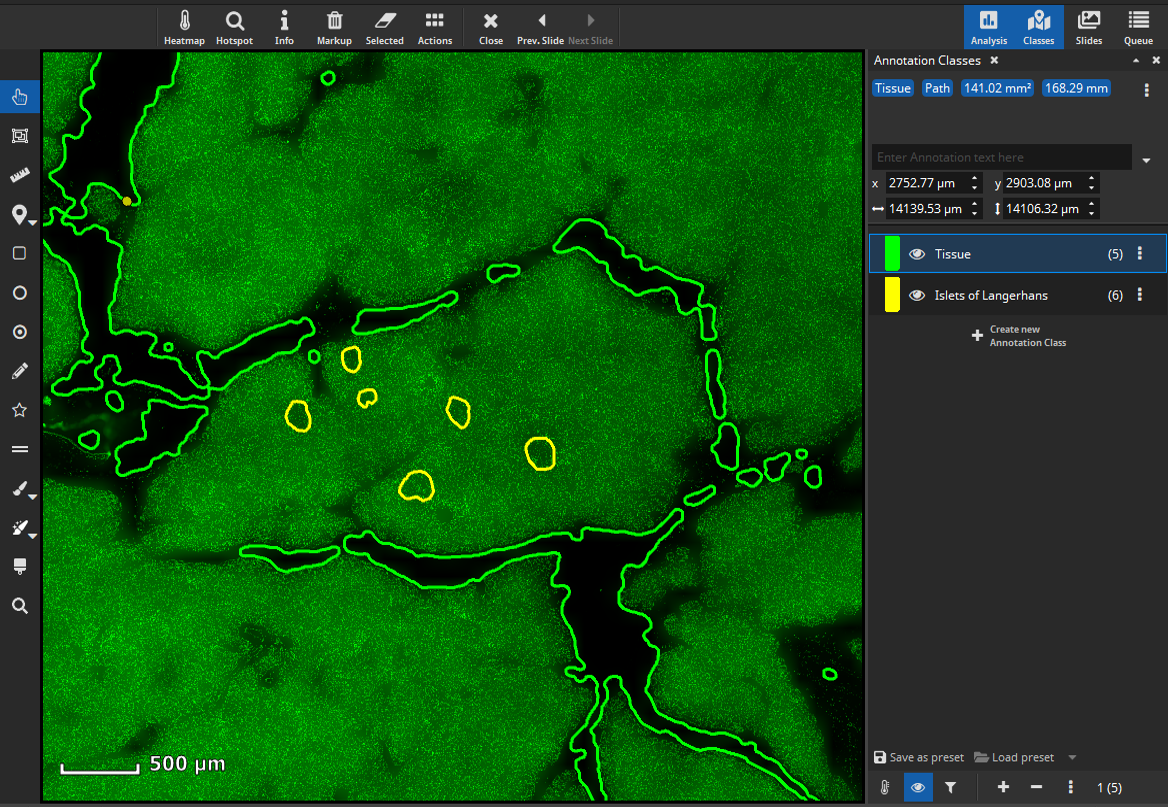
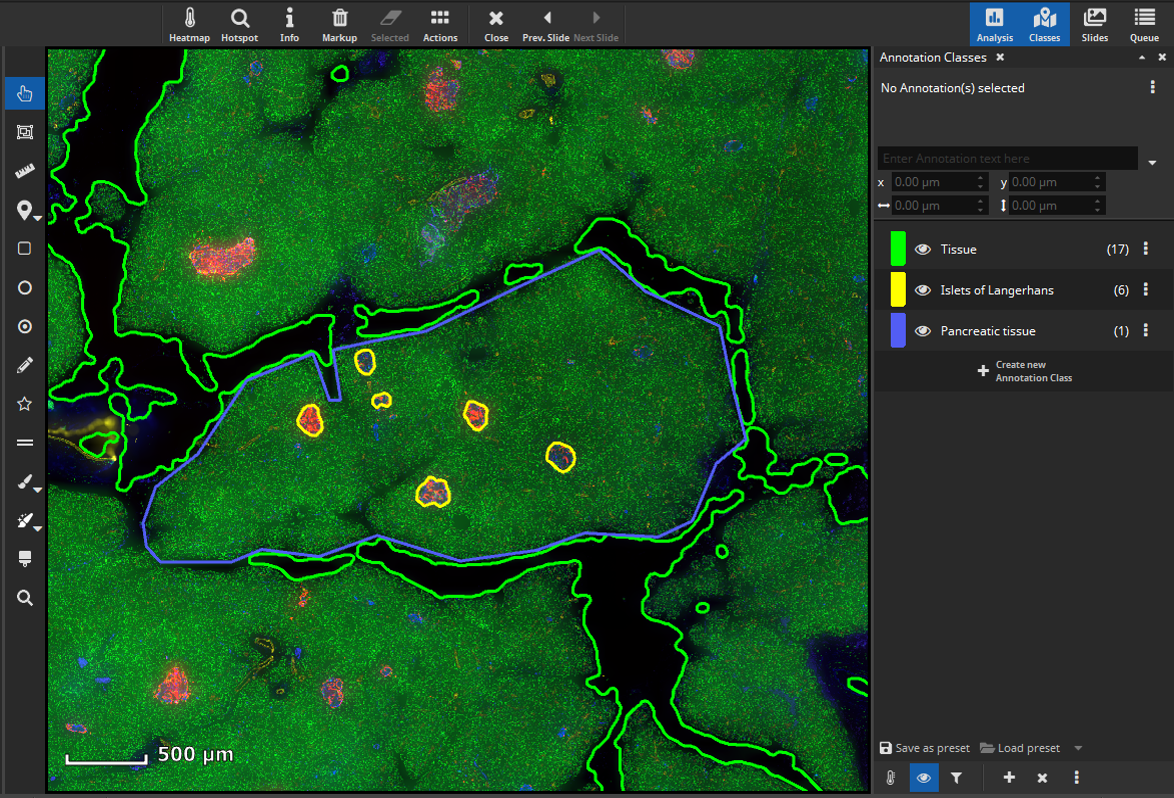
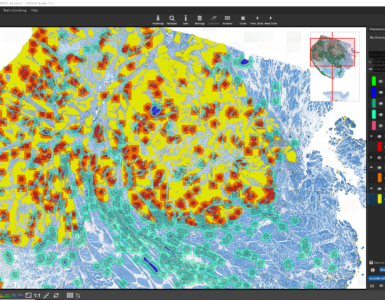
To perform a cell-based colocalization analysis of islets of Langerhans and pancreatic exocrine cells the FL Colocalization App can be used. First, we want to analyze marker coexpression of islets of Langerhans. Therefore, define a tissue class with representative annotations for islets of Langerhans according to your needs.
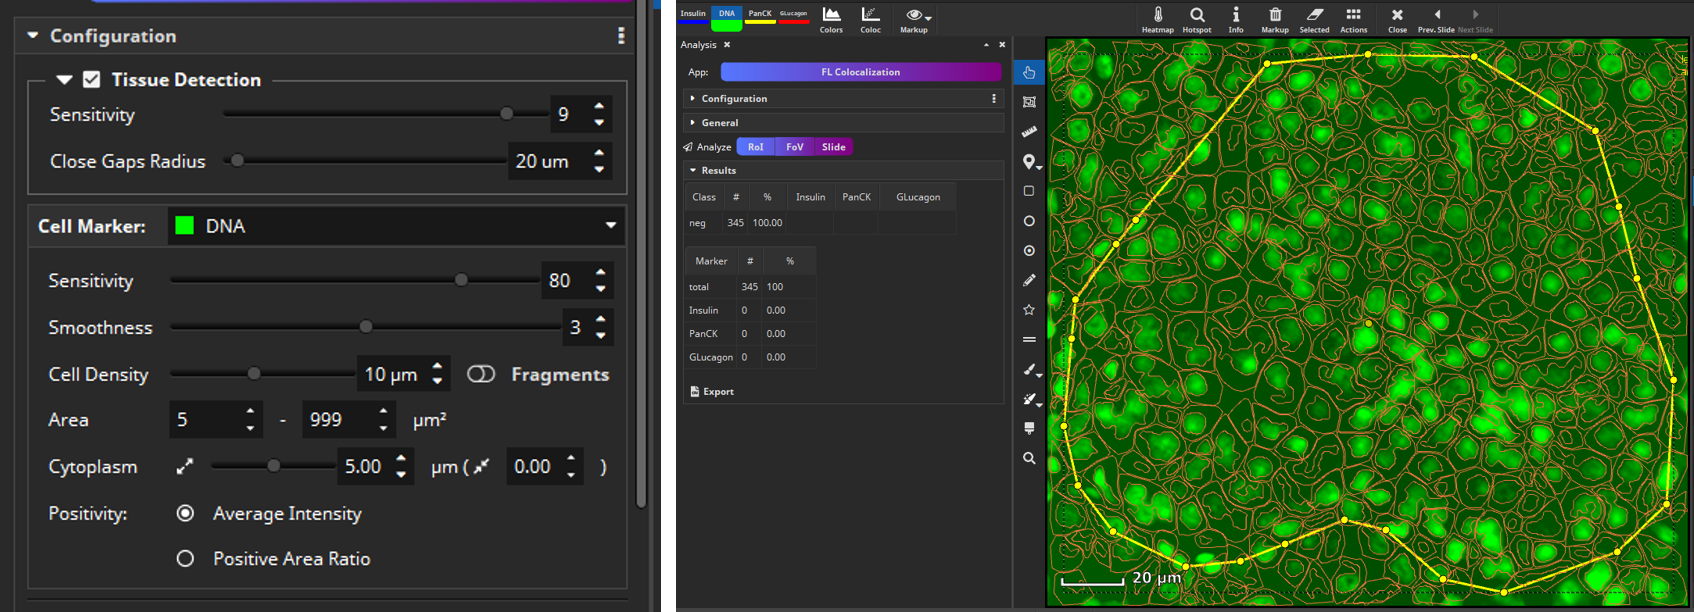
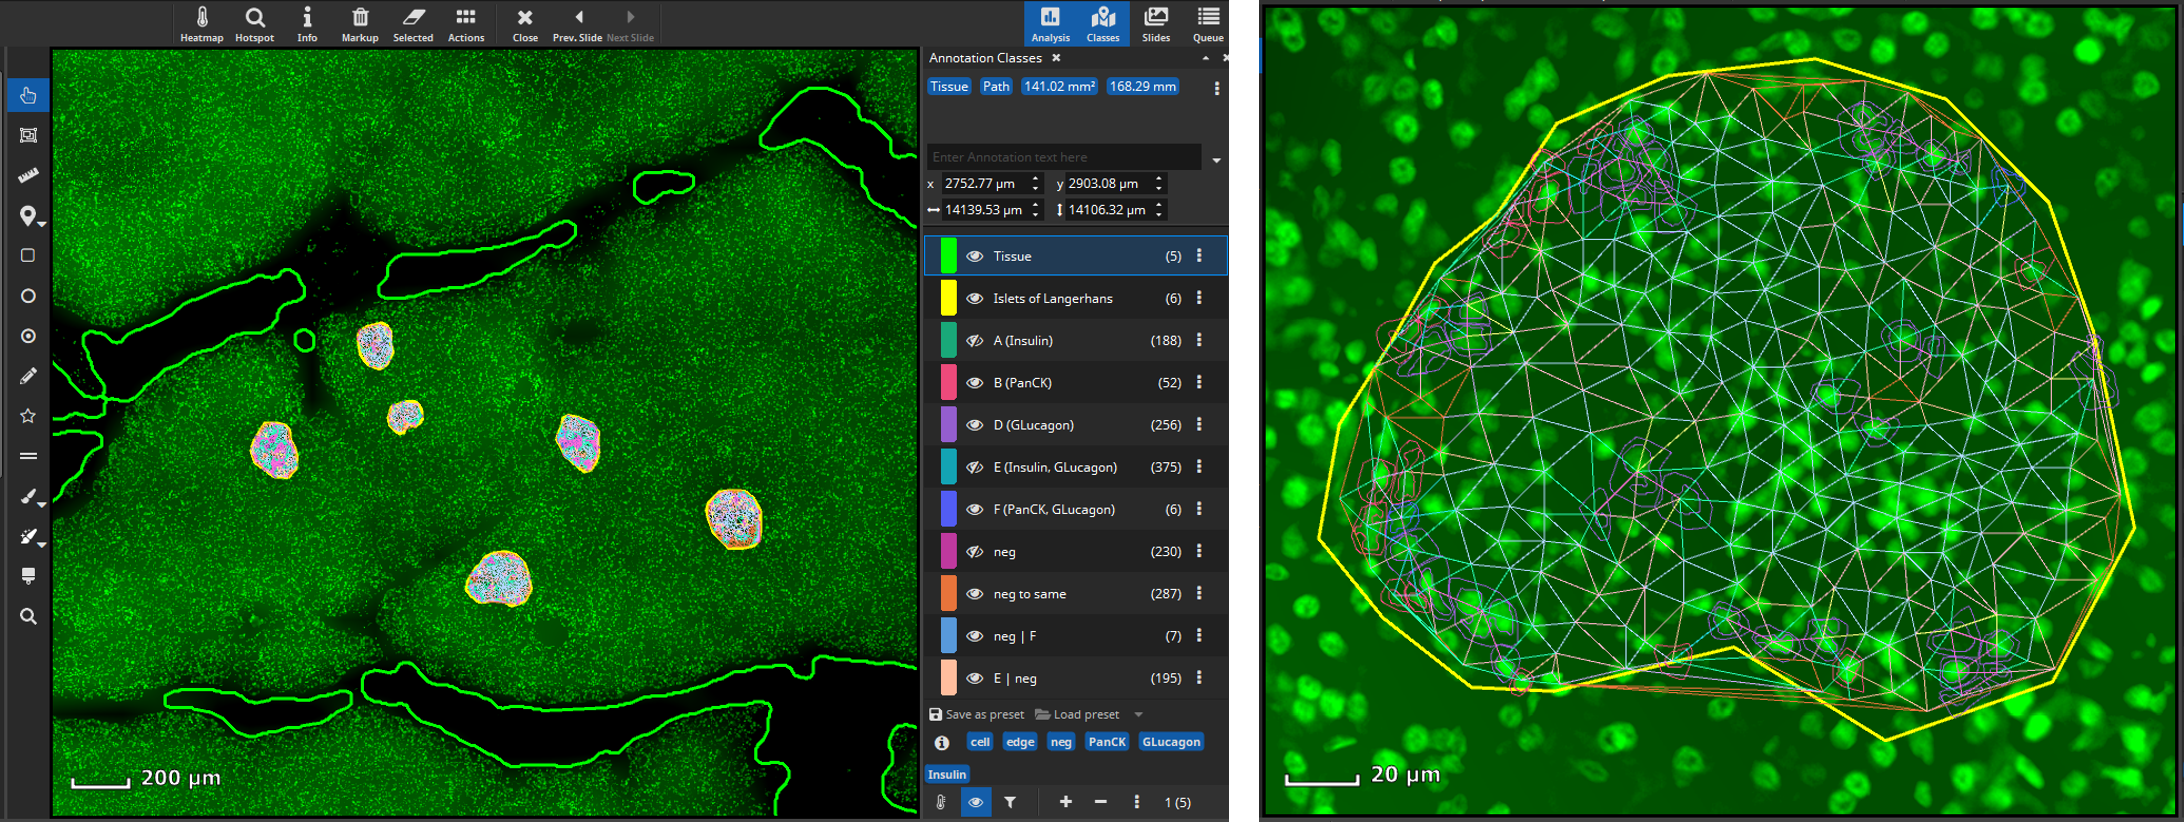
The app will first detect cells (nuclei) in a cell-marker channel such as DAPI. Select the channel that marks all cells and set up a desired value regarding sensitivity for detecting nuclei, segmentation of cells (smoothness), and average distance between cell centers (cell density). Each detected cell is then dilated by a user-defined margin (cytoplasm, e.g., 5 µm), since the cell marker channel typically represents the nucleus and the remaining markers may include ones that are expressed only in a cell’s cytoplasm or membrane.
Then select manually per marker, which signal level (mean fluorescence intensity, MFI) is considered positive, because sometimes a weak signal does not mean the marker is really expressed. This evaluation can be configured to be carried out only in the nucleus (“N”), only in the cytoplasm (“C”) or in both compartments of the cell (“N+C”). Based on the thresholds you configured, MIKAIA will then decide per cell which markers are expressed. As an optional 2nd constraint, you can require that also a certain ratio of this area exceeds the threshold. This is useful when you want to require that a certain signal level is expressed throughout large portions of the nucleus or cytoplasm area.
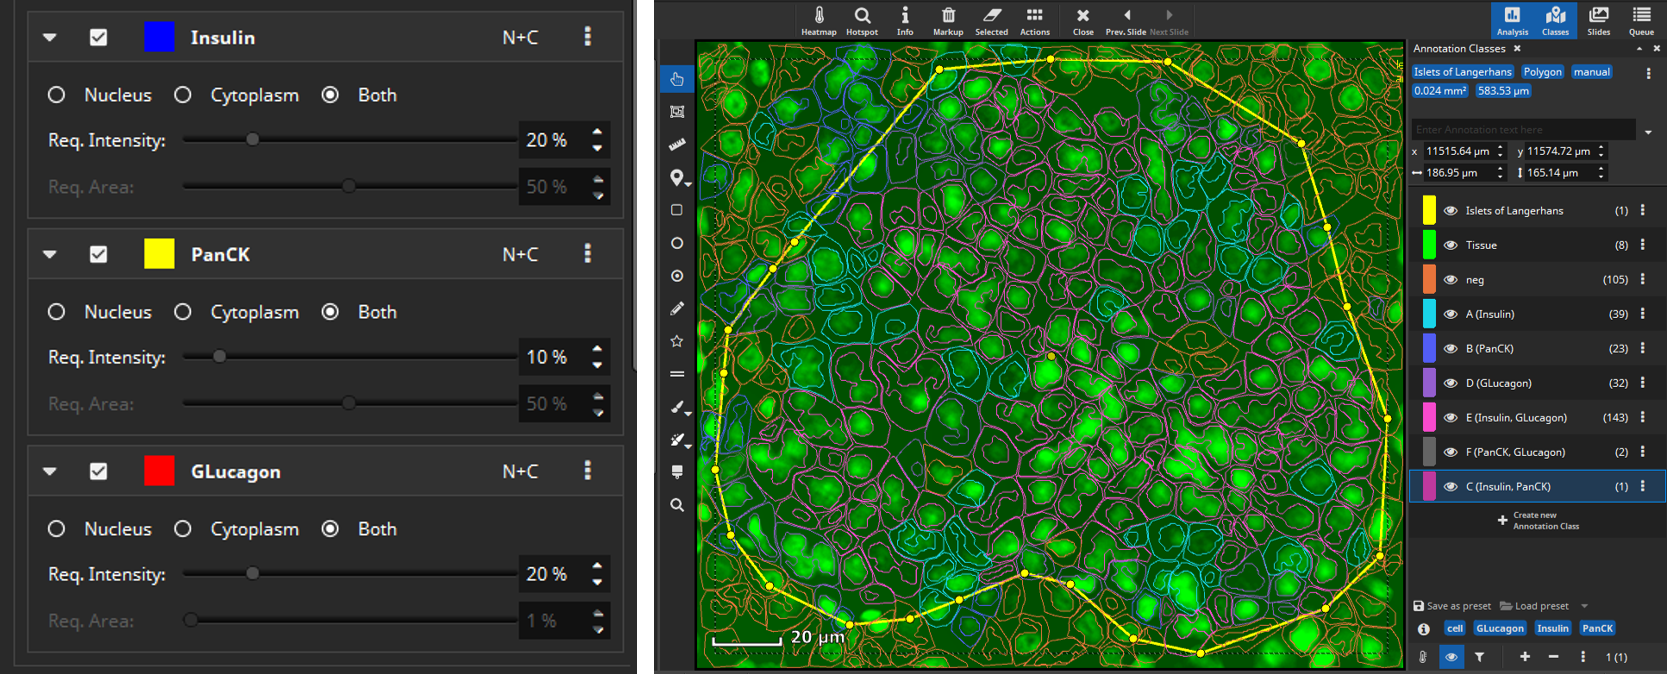
After selecting signal levels for every marker of interest a per-cell coexpression analysis can be performed. MIKAIA will compute the mean fluorescence intensity for each cell per marker separately in the nucleus and cytoplasm. Based on the thresholds you configured, MIKAIA will then decide per cell which markers are expressed. Each occurring marker combination will then become an annotation class (“A”, “B”, “C”, …) that represents a particular phenotype. Since some marker combinations may not exist, the classes are not strictly alphabetic, but some letters may be missing.
Coexpression analysis in pancreatic exocrine cells
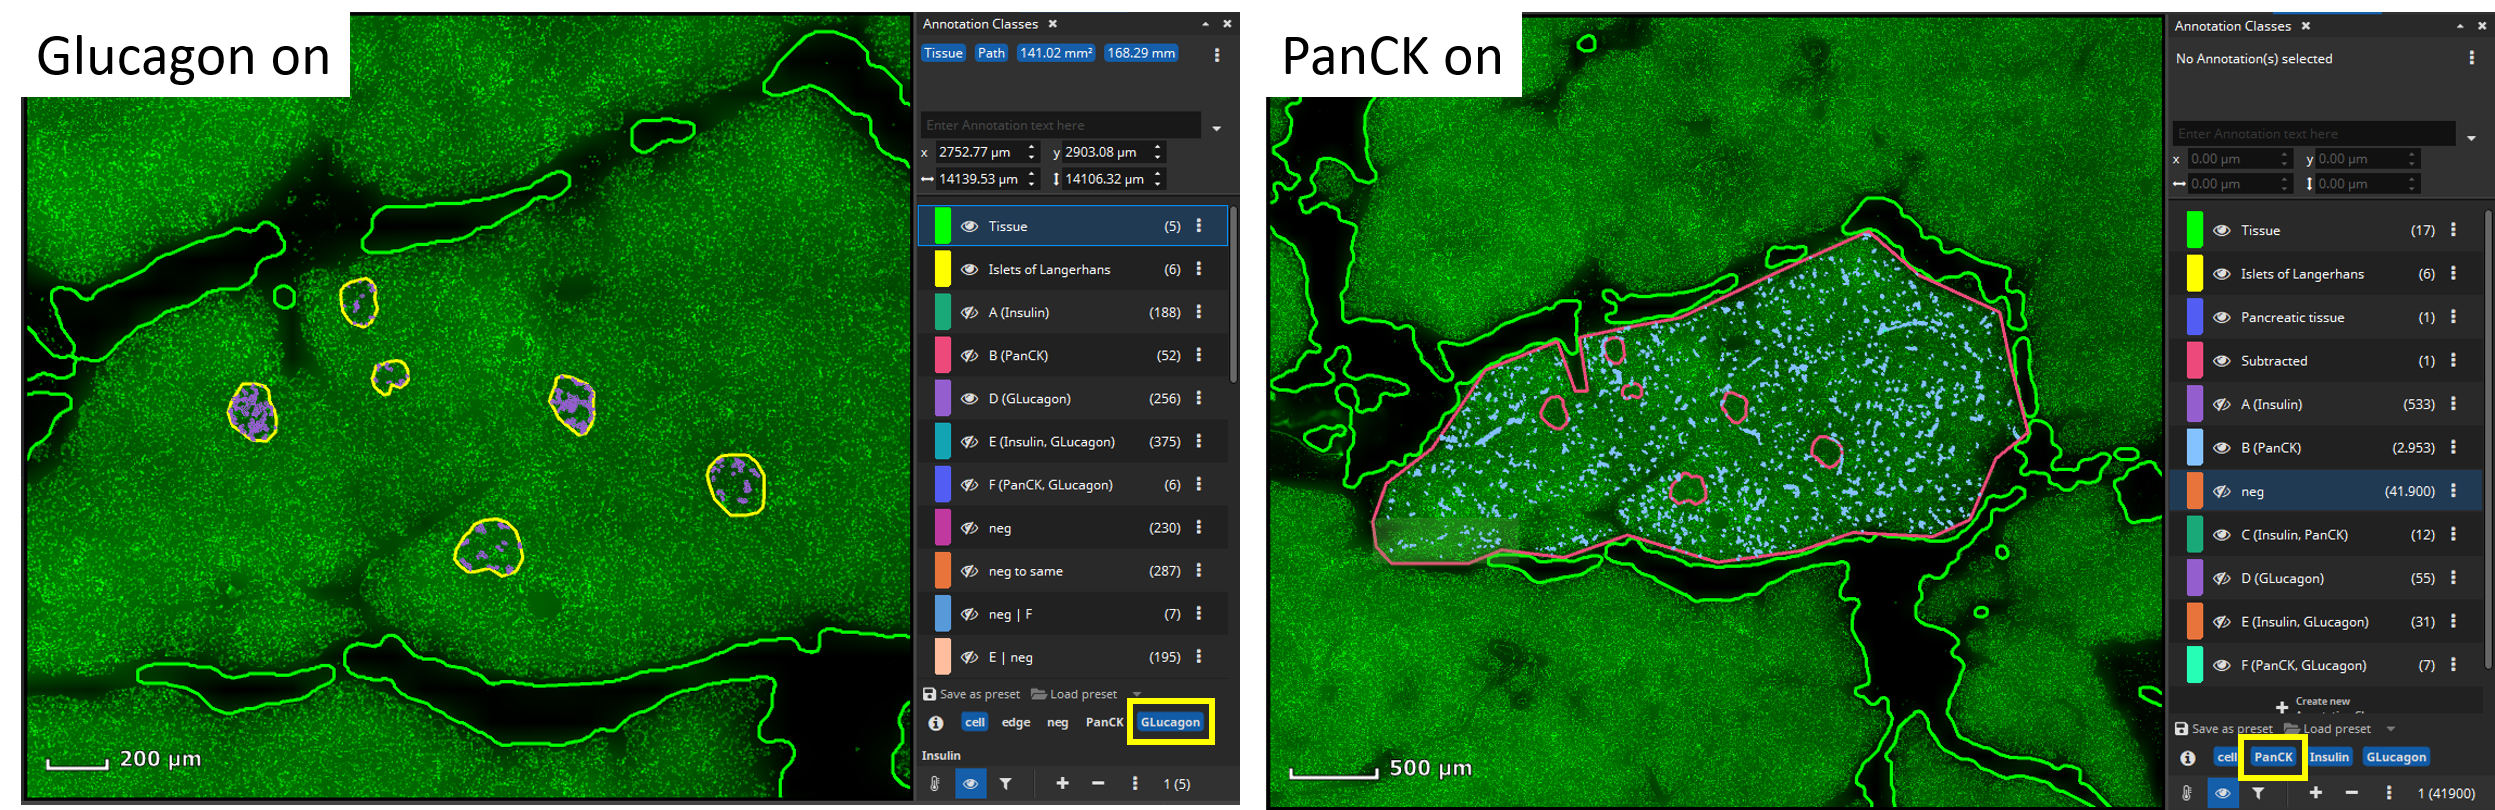
Islets of Langerhans are supported by a mass of branching exocrine tissue (Docherty & Russ, 2019). To analyze marker coexpression in this part of the pancreas outline a tissue region with an annotation (here: “pancreatic tissue” in blue) surrounding your previously annotated islets of Langerhans (yellow).
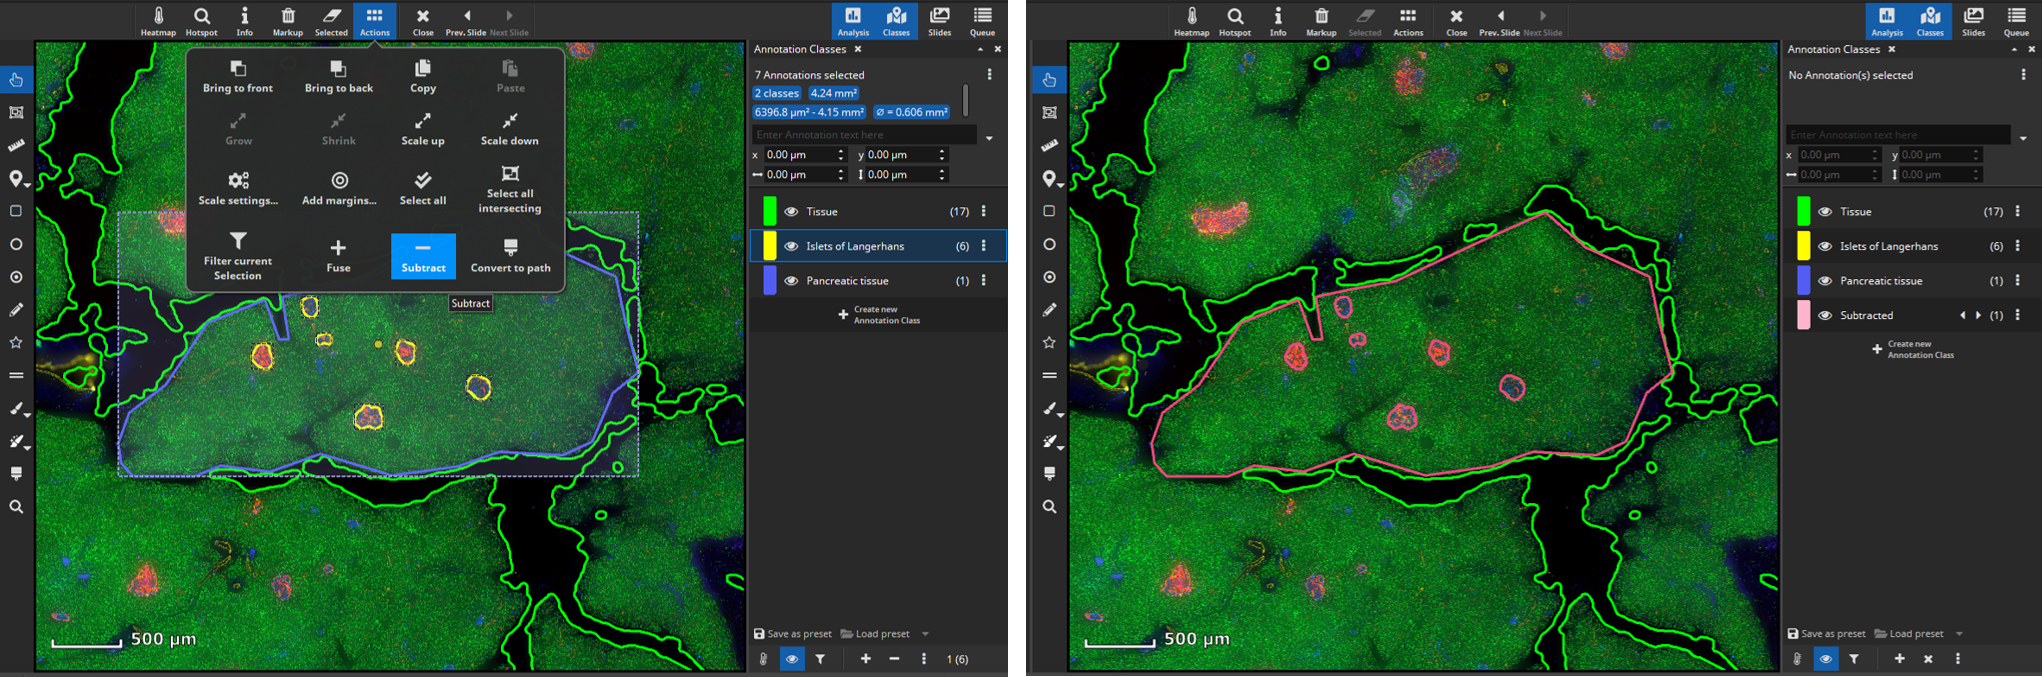
Next, create a mask that covers only the tissue without the islets of Langerhands. To achieve this, select all annotations (yellow and blue) and click the “Subtract” button, located in the “Actions” popover in the main toolbar. The software will then subtract the smaller annotations (yellow) from the largest annotation (blue) resulting in a newly formed tissue class (“Subtracted”, pink) comprising the exocrine tissue without the islets of Langerhans.
Output
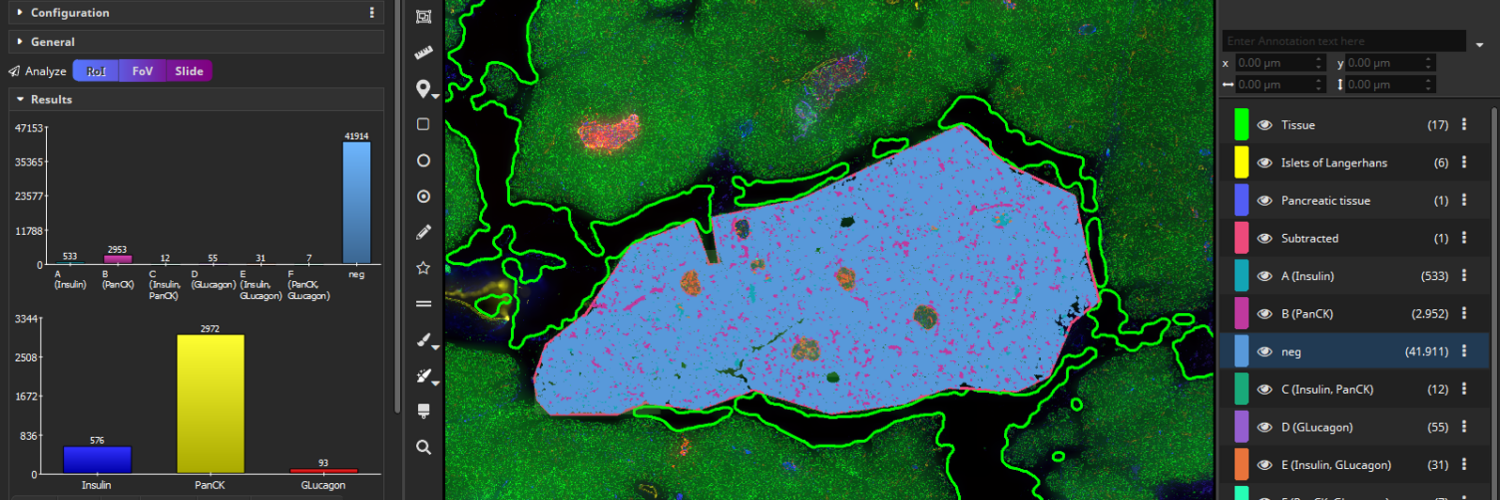
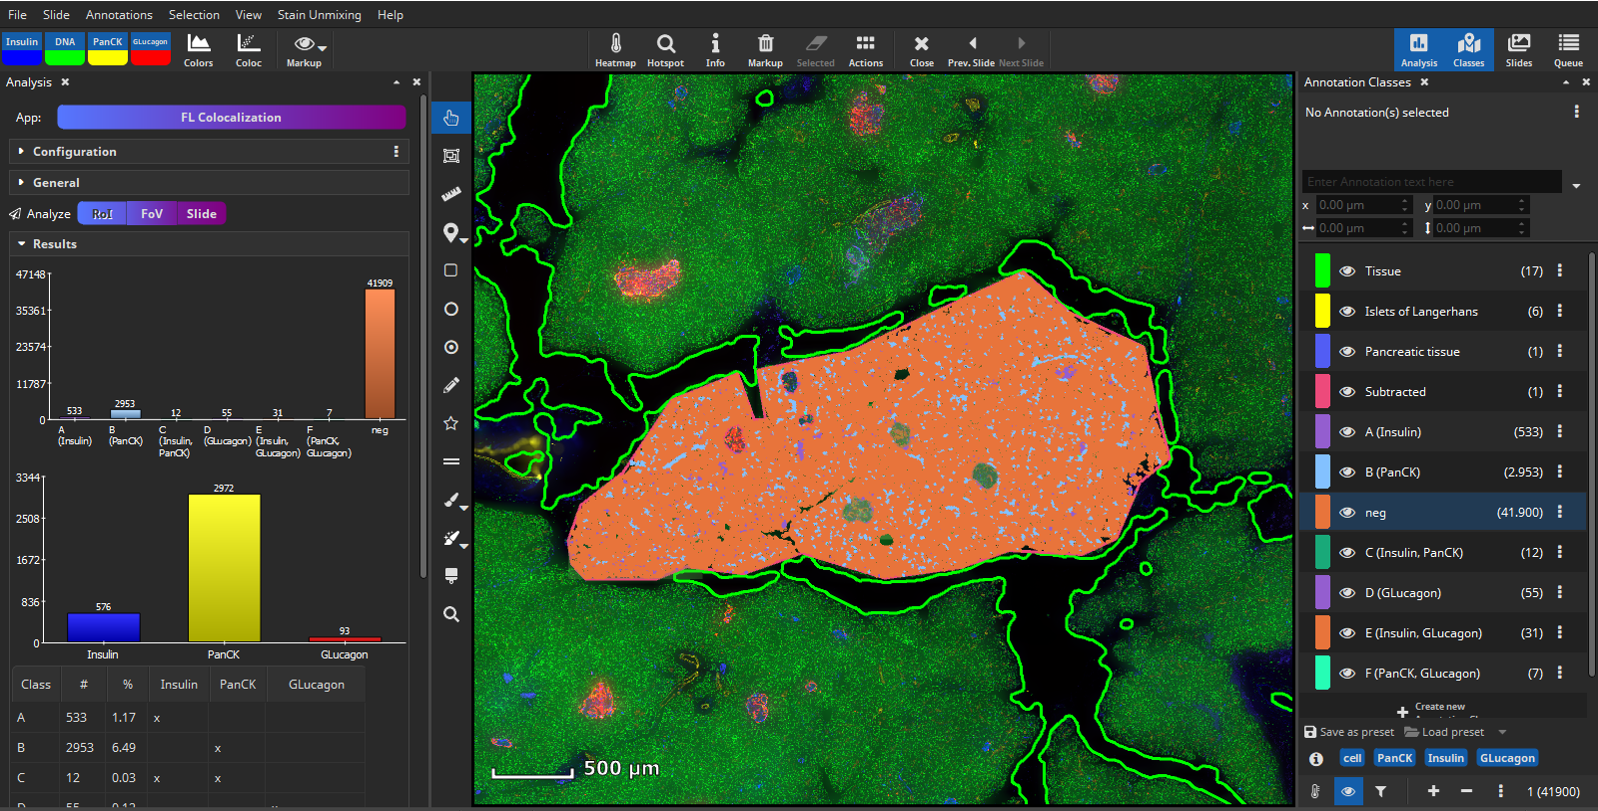
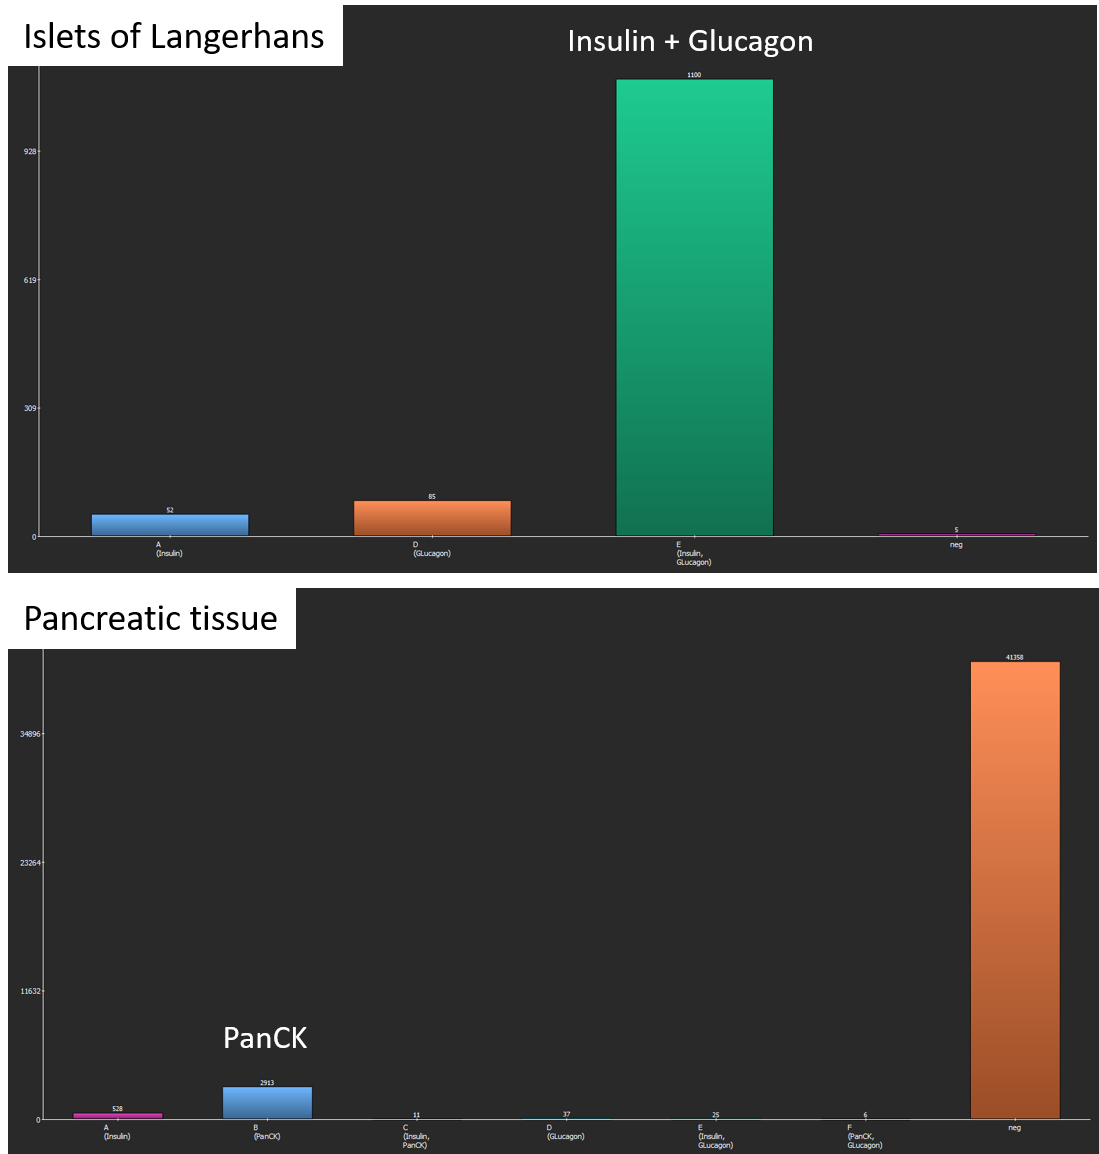
After the analysis has finished, two bar diagrams and two tables are displayed. They show the amounts of cells (1, top) by marker combination and (2, bottom) by marker. Islets of Langerhans consist of glucagon-producing α-cells and insulin producing β-cells (Xavier et al., 2018) which is confirmed by the coexpression analysis. In contrast, exocrine cells of the surrounding pancreatic tissue mainly contain PanCK+ epithelial cells.
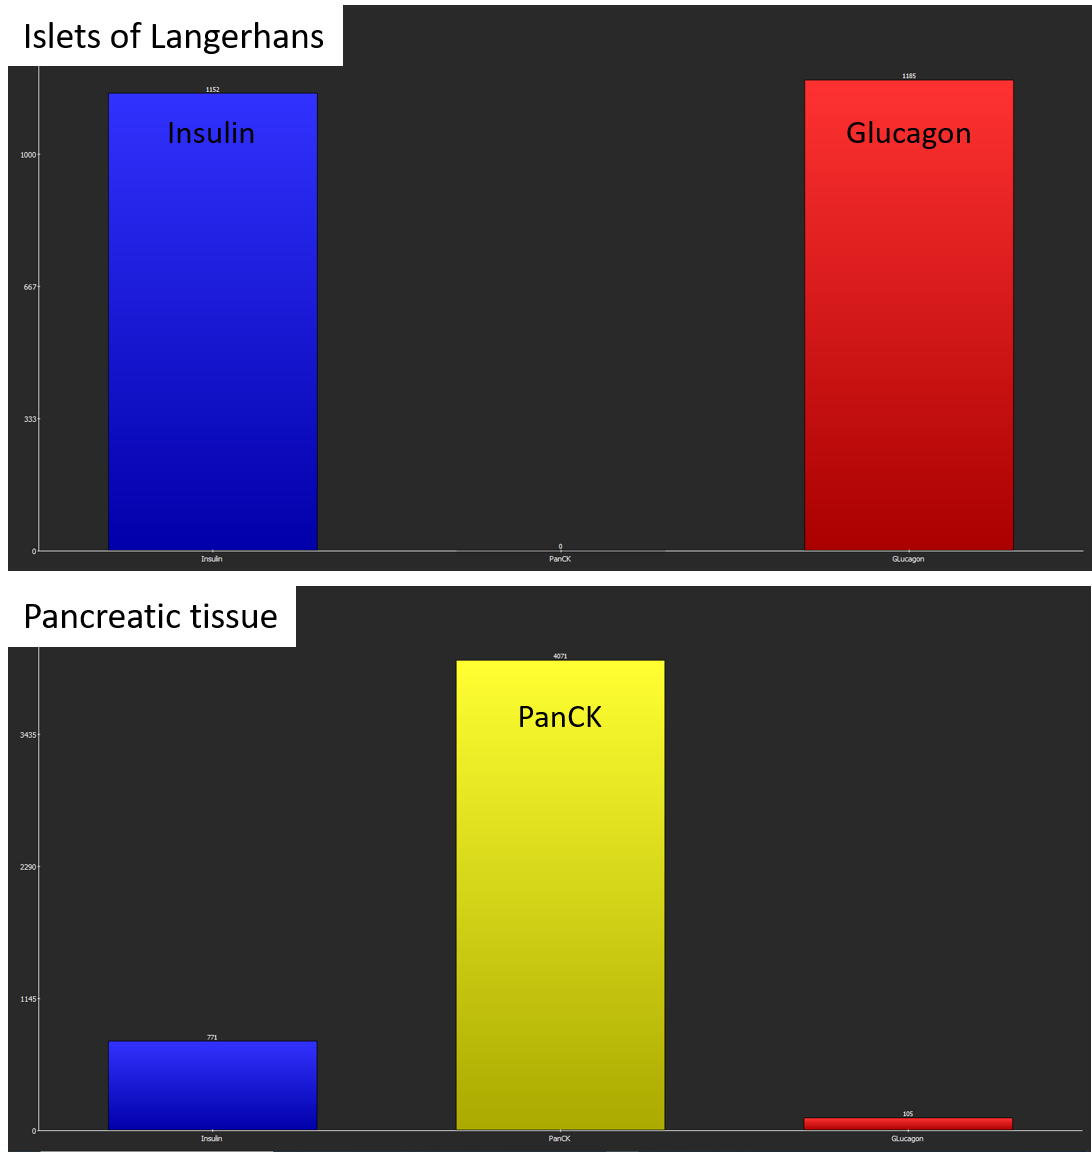
Coexpression analysis shows suitable results with regard to marker combinations. In islets of Langerhans, most cells coexpress Insulin and Glucagon, whereas pancreatic exocrine cells almost exclusively express PanCK.
Individual cell classes as well as the whole-slide-image channels can be hidden or shown. Additionally, generated annotation classes (one per encountered marker combination) are “tagged” with marker-tags such as “Glucagon” or “PanCK” in this example. By clicking on a blue tag button (below the list of classes), all classes that include this marker are simultaneously toggled on/off.
The markup appearances can be configured individually per class, e.g., the outline and fill color can be changed. Also, all classes’ appearances can be globally changed via the “Markup” button in the main toolbar. It allows forcing outlined or filled cell annotations and the markup’s opacity can be changed. Finally, results can easily be exported into a CSV file that can be opened by Microsoft Excel or imported into R or Matlab for further statistical processing or to generate plots.
Spatial Analysis of cell neighborhoods
In a next step, it may be worthwhile to gain insights on possible interactions between cell types. The Cell-Cell Connections App is typically run on the results produced by the FL Colocalization App. It creates a line-annotation for each cell-cell connection separately for markers and marker combinations.
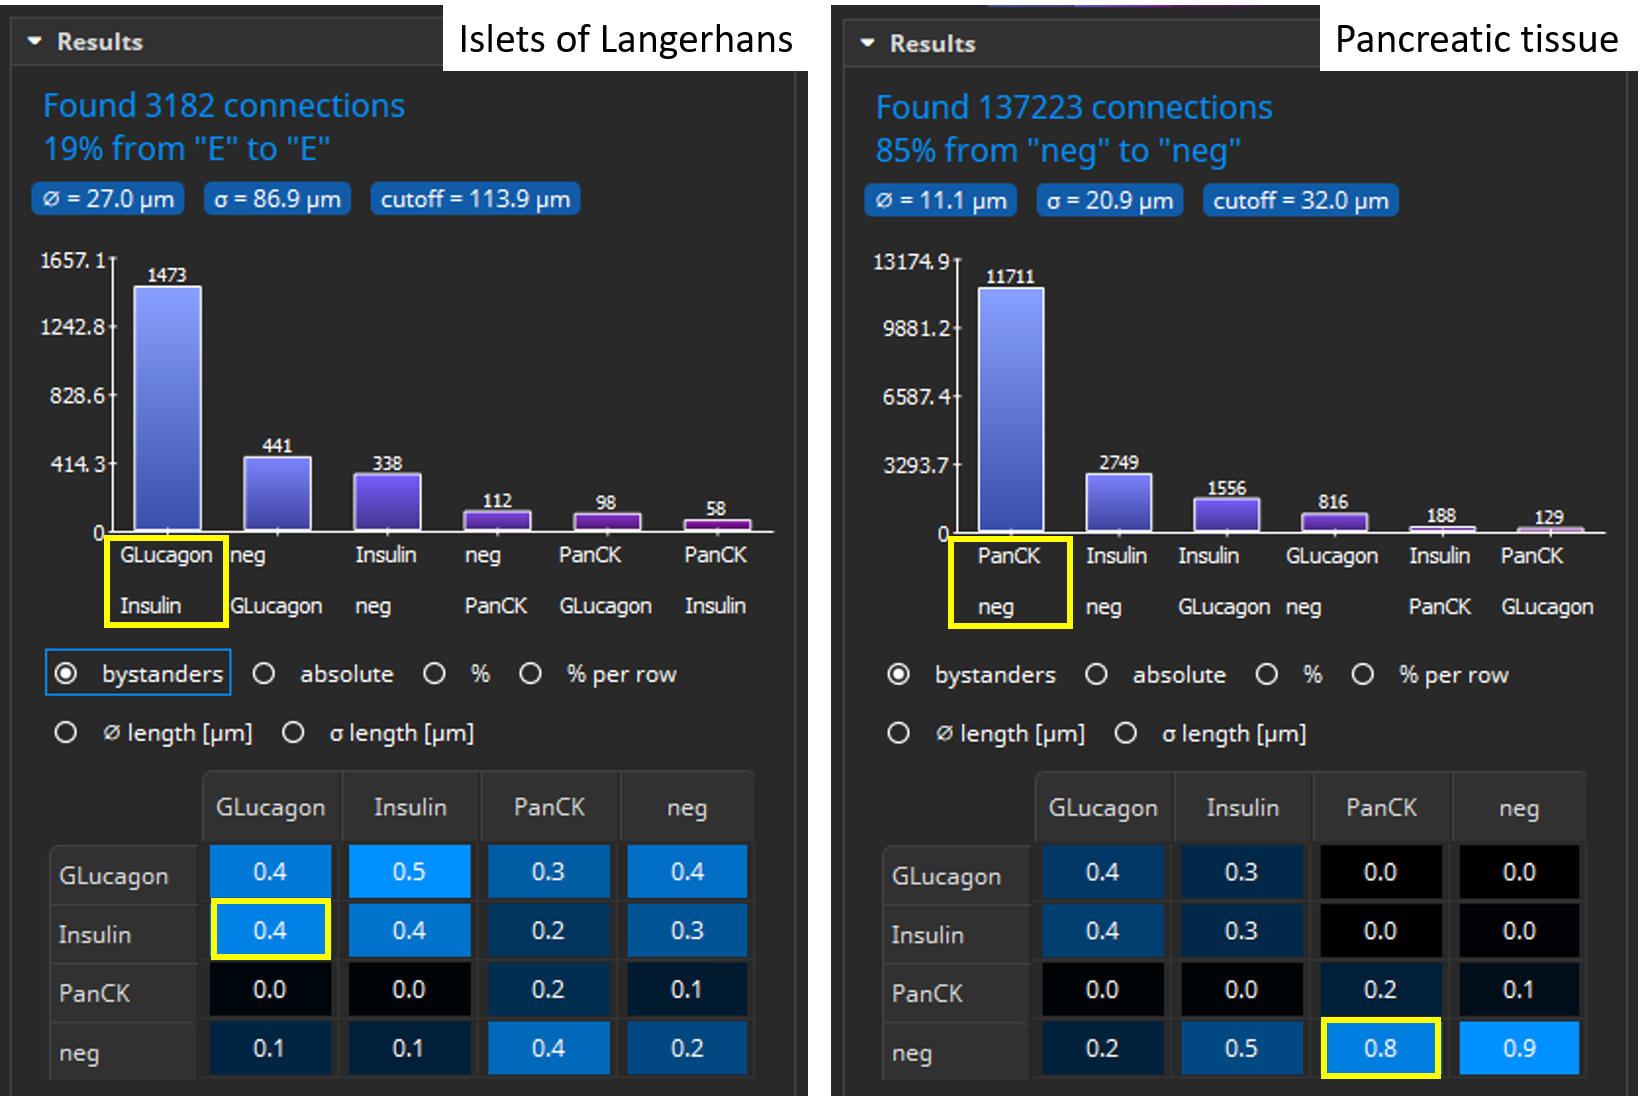
The Results pane shows a bar chart that visualizes which markers, respectively marker combinations, are most frequently located adjacent to one another (“are neighbors”). For instance, in Islets of Langerhans, Glucagon and Insulin positive cells are most frequently adjacent to one another, whereas in pancreatic tissue PanCK positive and cells negative for all markers are most frequent. By default, only connections between cells of different types are considered, though this can be configured. Additionally, a large table shows six matrices where the various classes (cell types) are listed both in the x and y axis. The table contains statistics such as the average distance (in µm) between cell types or a bystander analysis. For instance, in Islets of Langerhans Glucagon+ cells have on average 0.4 neighboring cells that are Insulin+ .


Add comment