

 Volker Bruns
MIKAIA studio v3.1 includes native support for viewing and analyzing multi-omics datasets created with Singular Genomics’ G4X™ instrument. G4X features 500plex transcriptomics, 18plex proteomics and same-slide morphology via fluorescent H&E (FH&E). Simply drag & drop the run_meta.json file that is contained in any G4X dataset into MIKAIA and it will open the multi-omics stacks. You can interactively select which image layer (H&E, all or subset of protein layers, no image at all) and which overlays (cell annotations, Leiden-clustered cells and/or transcripts) are displayed.
 Singular Genomics G4X scan opened in MIKAIA - protein and cell overlays are visible (open in new tab)


When zooming in, the transcript spots become visible. G4X scans feature a very high transcript density. Each gene is available as an annotation class, and genes’ visibility can be toggled on/off in the “Annotations” side panel.

Investigate transcript layer in Singular Genomics G4X scans
The transcriptome can be analyzed with the MIKAIA Cell x Gene App. In the below screenshot of a lung carcinoma, the tumor was manually outlined (class “ROI”). The Cell x Gene App was then run on the whole-slide in “only overview, no cell query” mode. In the “Divide by ROI” section, the created “ROI” class was selected. The app now assigns cell and transcripts contained within the outlined tumor to the tumor ROI. All remaining cells and transcripts are automatically assigned to the “other” ROI. Various statistics are now collected per ROI and can be compared to investigate biological differences. The diagrams in the results panel illustrate statistics per ROI. All statistics can also be exported to CSV and/or JSON.

Cell typing in Singular Genomics G4X scans
The transcriptome can be evaluated with the untyped or Leiden-clustered cell annotations already available in the dataset. Alternatively, the MIKAIA FL Cell AI / FISH App can be used for single cell analysis. Two options are available:
- phenotyping only: skip AI cell segmentation – use existing annotations and only do phenotyping.
- segmentation + phenotyping: Run a AI cell segmentation from scratch using MIKAIA’s cell segmentation AI (fast regular model, or foundation-model based “XXL AI”) and then do phenotyping.
For the phenotyping-only option, use the app’s new “Existing cells” mode and select “analyze & phenotype cells”:
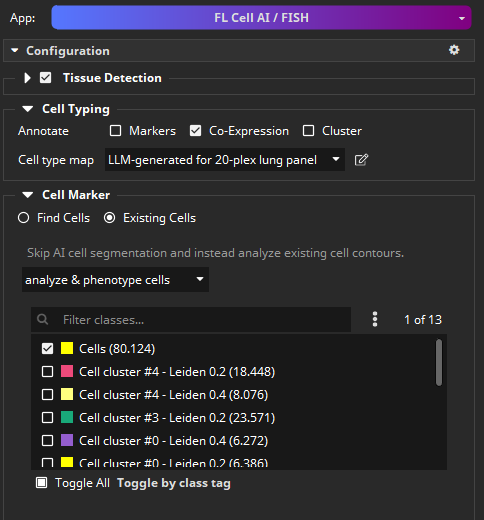
For phenotyping, the app will measure the protein expression for each protein marker in each cell. The measured expression is then compared against a threshold to decide if the protein is expressed in a cell or not. It is most convenient to set the threshold to “auto”, in which case a threshold will automatically be picked per marker at the end of the analysis, when all cells’ expressions are known. Subsequently, the picked thresholds can be manually adapted on a marker-by-marker basis, if required.
Additionally, it is recommended to select whether the expression in the nucleus or cytoplasm+membrane (the App uses a 2-cell-compartments model at the moment) or in the entire cell should be used. The choice depends on the marker. Click “Auto-select marker type & analysis with LLM” to generate an LLM prompt that asks for the recommended choice for each marker. Copy & paste it into your favorite LLM, copy & paste its response back into the dialog and MIKAIA will then process the response and automatically set each marker’s type and analysis. In the below example, most markers are set to “protein / cytoplasmic or membranous”, but e.g. FoxP3 and Ki67 are both set to “protein / nuclear”, as expected.

Relating transcriptome to proteome
Now that cell types have been determined based on the proteome, the Cell x Gene App can be re-run to obtain transcriptomic statistics broken down by proteome-defined cell phenotypes:

Automatically find ROI: Train custom tumor detection AI with AI Author
Instead of circling the ROI manually, as was done above, the same-slide H&E layer available in G4X datasets can be used to segment tissue types. Here, we keep it simple and train a small “lung” AI model using the Classification AI Author. A single tumor annotation (blue) and non-tumor annotation (pink) is drawn and the model trained. Subsequently, we run the AI on the entire slide to obtain a tumor and non-tumor mask. Then, in the Cell x Gene App’s “Divide by ROI” section, we select the “tumor “class as the ROI in order to obtain separate transcriptome statistics for inside vs. outside the tumor.





Add comment