

About 20 % to 25 % of breast cancers depend on amplification and overexpression of the gene human epidermal growth factor receptor 2 (HER2). The HER2 overexpression status will initially be assessed by immunohistochemistry (IHC) using a semiquantitative scoring system. In case of an unclear IHC score detection of HER2 gene amplification by fluorescence in situ hybridization (FISH) is required. The HER2 status of the cancer helps determine whether molecular drugs that target the HER2 receptor, such as trastuzumab (Herceptin), might help treat the cancer (Wolff et al., 2006; Sauter et al., 2009).
In this MIKAIA® University application note, we demonstrate how a HER2 scoring can be performed with the help of the MIKAIA® HER2 FISH App.
This app, like all MIKAIA® apps, is for Research Use Only (RUO) and not
cleared for clinical use.
Configuration
The app performs a HER2 FISH scoring, which is used to assess whether a HER2 overexpression exists. FISH images with three markers can be analyzed by the app. First, the nuclei in the DAPI channel are detected and the contours traced, while overlapping nuclei are split. Then, the app detects red and green spots inside the nuclei that mark HER2 and CEP17 gene amplifications, respectively.
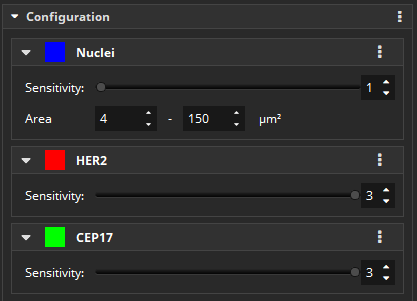
The app only evaluates eligible cells that have at least one HER2 and one CEP17 spot, are not suspiciously small or large, and do not touch the image edge.

Results
The sub header states the total number of detected spots and nuclei. The HER2/CEP17 ratio quantifies the number of HER2 gene copies on chromosome 17 in relation to the number of chromosome 17 centromere (CEP17) copies per nucleus.

Next, three plots are shown. The HER2/CEP17 Ratios plot shows a histogram over all detected ratios with a bin width of 0.5. At first glance, one can see which ratios occur and which ones are predominant.

The Copy Numbers plot shows a histogram (per gene) over all detected spots per cell. In this example, it is visible at first glance that the majority of cells contain two spots per type.

The Copy Numbers Scatter Plot shows a 2D histogram of which spot combinations occur most frequently. In this example, the largest group (36,2 %) of nuclei contain exactly two spots of each class, followed by a group (20,8 %) that contain exactly one spot of each class.

Based on the ratio of HER2 to CEP17 genes, each cell is assigned to one of three classes
- “positive” (H/C >= 2.2 or >= 6 HER2 spots)
- “equivocal” (H/C between 1.8 and 2.2 or >=4 HER2 spots) or else
- “negative”
(according to ASCO/CAP guidelines 2007; for updated guidelines see ASCO/CAP guidelines 2018).
The overall HER2 to CEP17 ratio is computed by averaging over all detected cells. Cells touching the image border or exceeding an average area are excluded from the calculation.

A list of all detected cells and the associated properties, including the number of detected markers can be exported to a csv-file.


Add comment