
In this MIKAIA University application note, we guide you through the analysis of a common use case, coexpression of marker combinations in lymphoid follicles and interfollicular tissue in a tonsil 15plex imaged with Akoya PhenoCycler-Fusion.
Coexpression analysis in lymphoid follicles
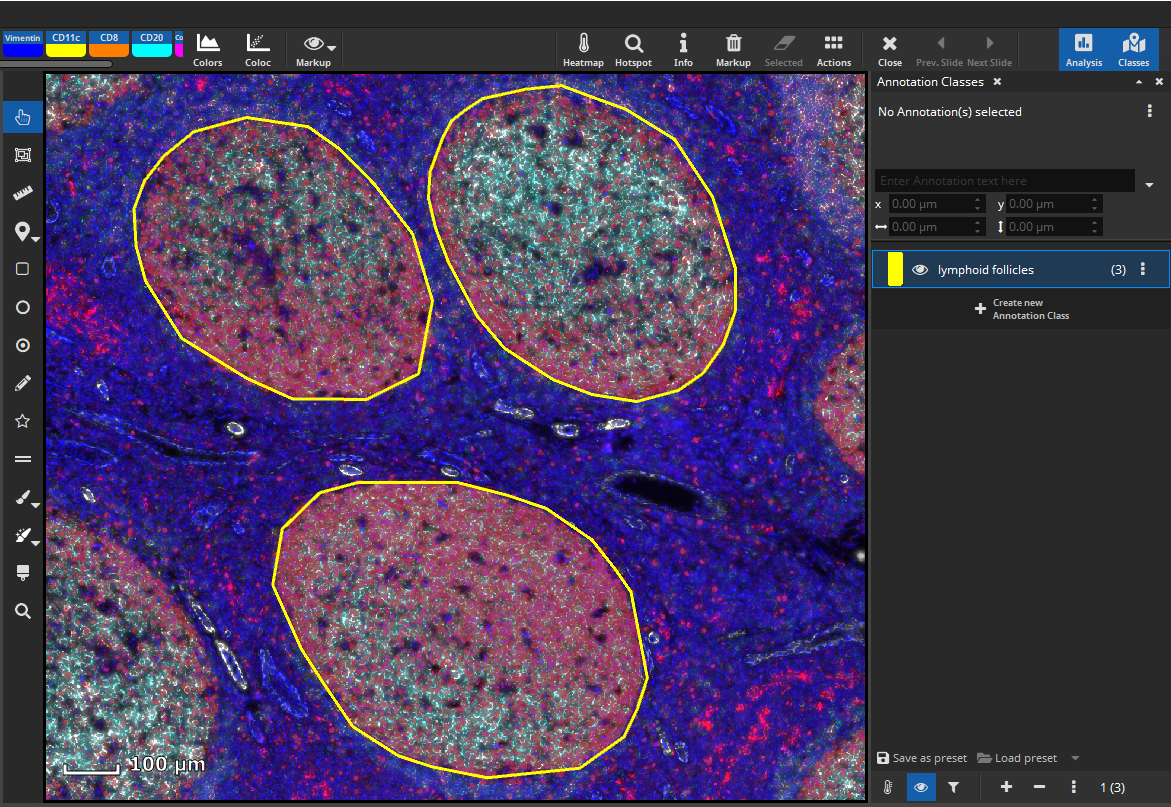
First, we would like to analyze marker coexpression in lymphoid follicles. For a cell-based colocalization analysis, open the App Center, and select the FL Colocalization App. Then define a tissue class with representative annotations according to your needs, e.g., three different lymphoid follicles, respectively.
Update 26.9.2023
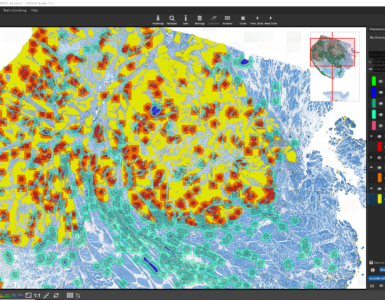
Many user have requested to add a possibility to select a tissue type and then automatically generate masks for downstream cell analysis. This feature is now introduced with the release of MIKAIA 1.4:
It is now also possible to define your regions of interest automatically by using the Mask by Color App. This app creates masks by thresholding one (or multiple) color channels. In this example the CD20 is well suited to derive a masks as it is highly expressed in lymphoid follicles.
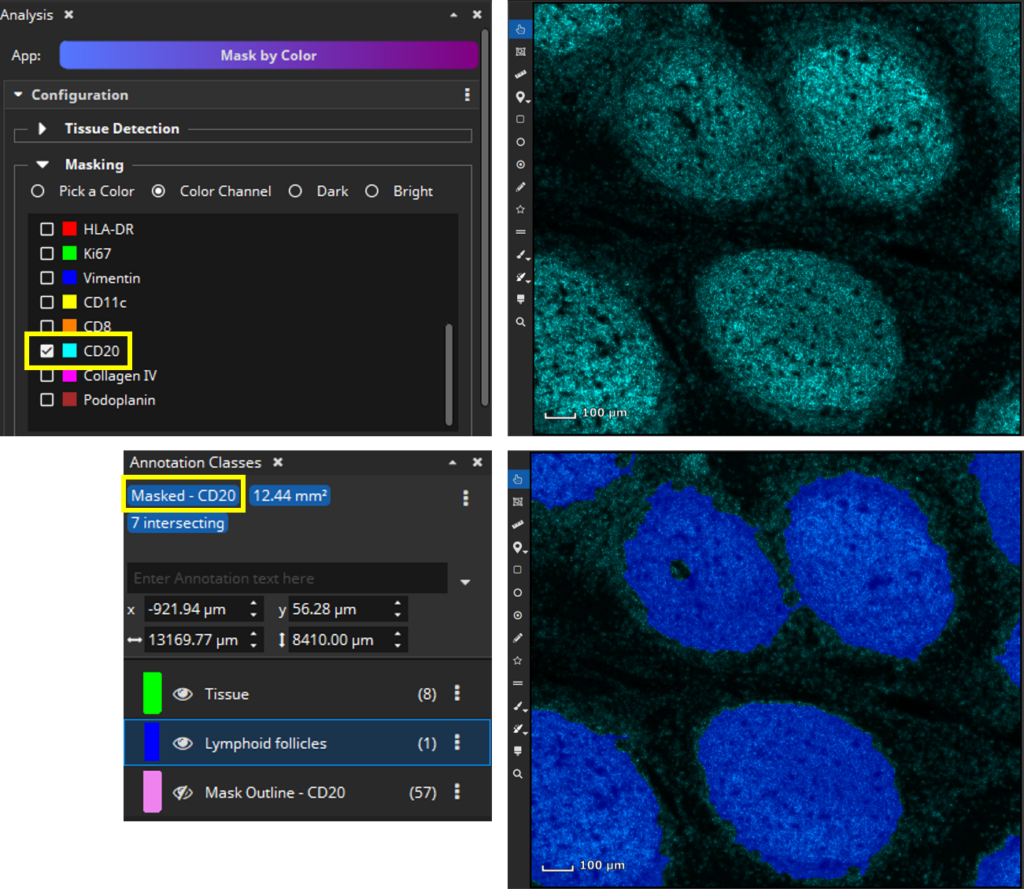
(end of update 26.9.2023)
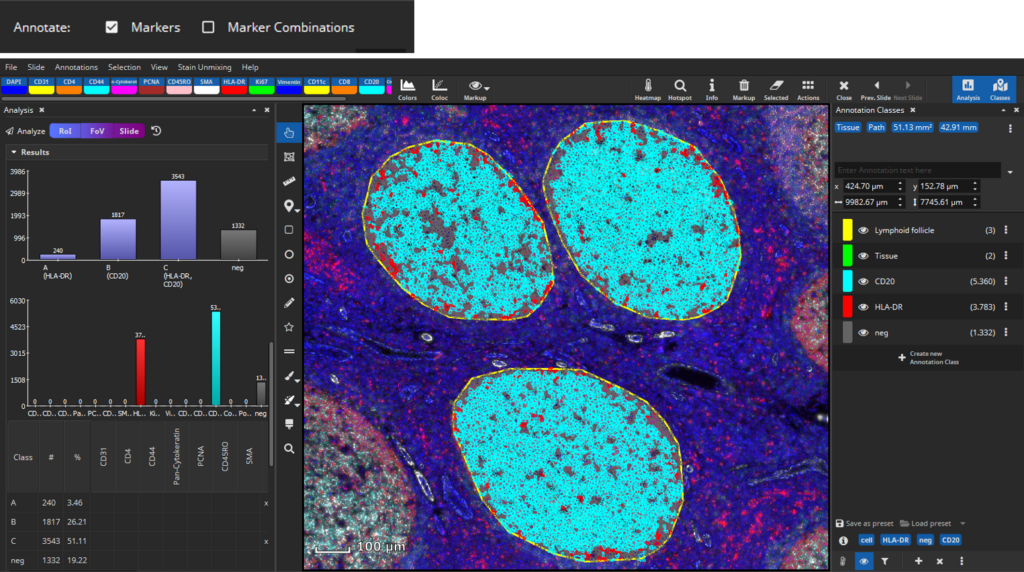
The FL Colocalization App will first detect cells in a cell-marker channel such as DAPI. Select the channel that marks all cells and set up a desired value regarding sensitivity for detecting nuclei, segmentation of cells (smoothness), and average distance between cell centers (cell density). Each detected cell is then dilated by a user-defined margin (cytoplasm, e.g., 5 µm), since the cell marker channel typically represents the nucleus and the remaining markers may include ones that are expressed only in a cell’s cytoplasm or membrane.
Then select manually per marker which signal level (MFI) is considered positive, because sometimes a weak signal does not mean the marker is really expressed. This evaluation can be configured to be carried out only in the nucleus (“N”), only in the cytoplasm (“C”) or in both compartments of the cell (“N+C”). Based on the thresholds you configured, MIKAIA will then decide per cell which markers are expressed. As an optional 2nd constraint, you can require that also a certain ratio of this area exceeds the threshold. This is useful when you want to require that a certain signal level is expressed throughout the entire nucleus or cytoplasm.
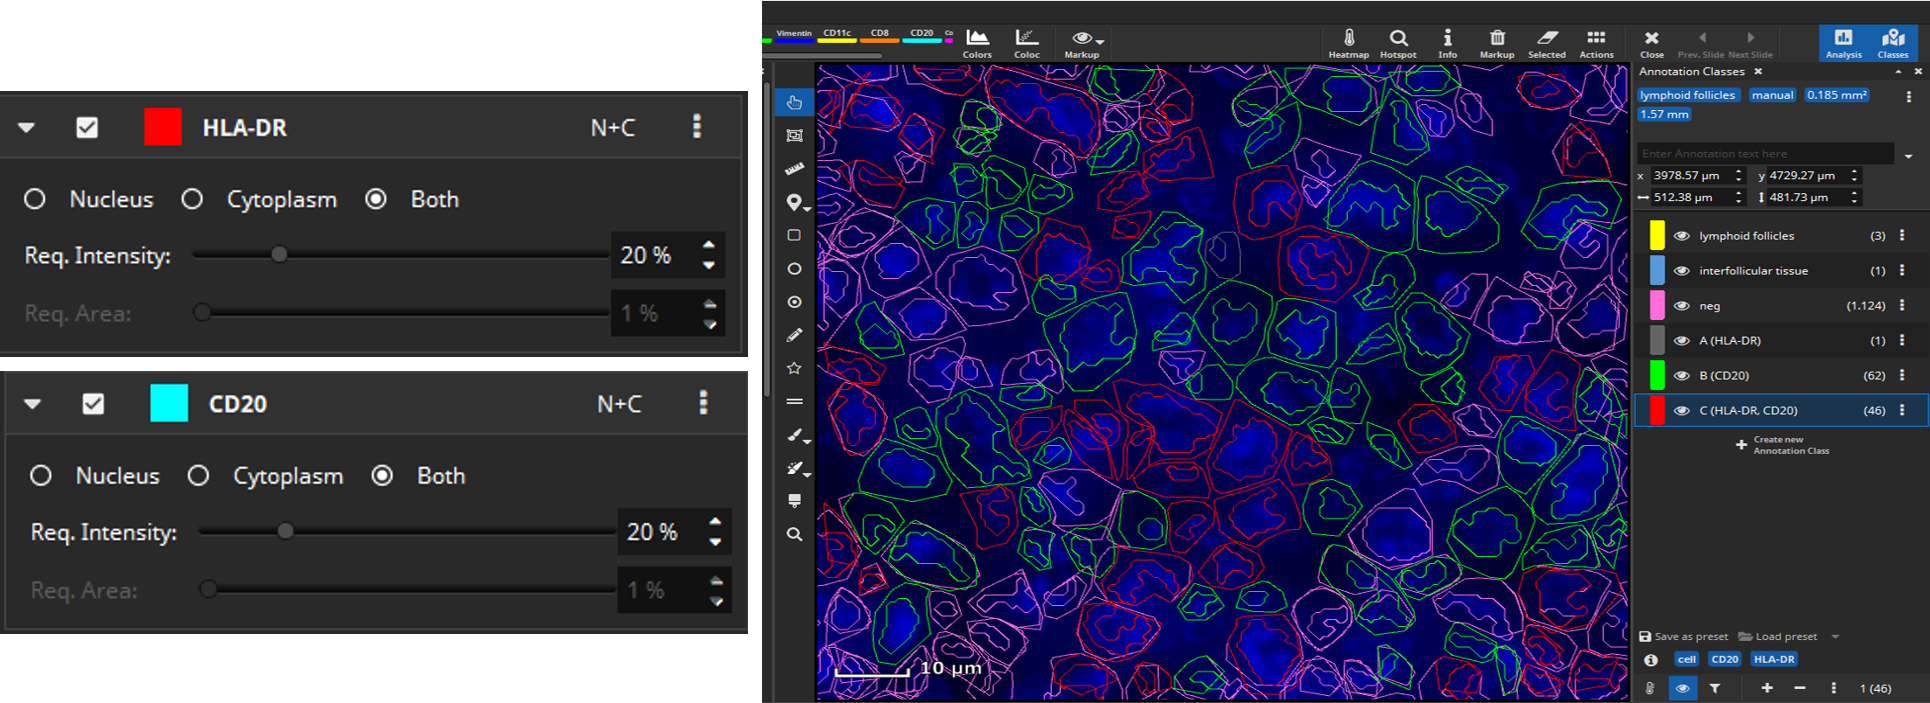
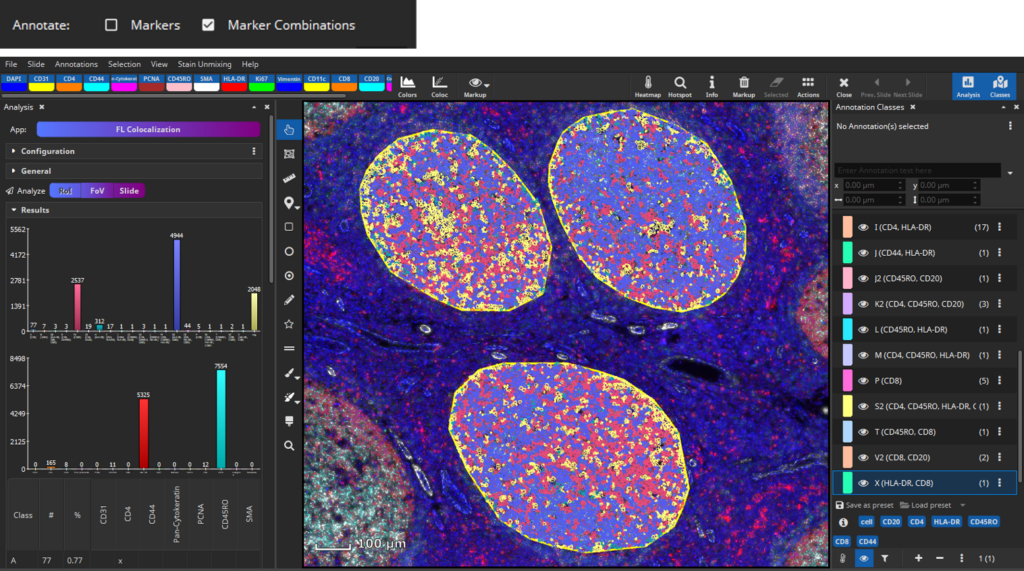
After selecting signal levels for every marker of interest colocalization analysis can be performed. MIKAIA will compute the mean fluorescence intensity for each cell per marker separately in the nucleus and cytoplasm. Based on the thresholds you configured, MIKAIA will then decide per cell which markers are expressed. It is possible to analyze marker expression individually, marker combinations, or both (Update 26.9.2023). Each occurring marker combination will then become an annotation class (“A”, “B”, “C”, …) that represents a particular phenotype. Since some marker combinations may not exist, the classes are not strictly alphabetic (“A,B,C..”), but some letters may be missing.
Coexpression analysis in interfollicular tissue
Up next, we would like to analyze marker coexpression in interfollicular tissue. Again, define a tissue class with representative annotations according to your needs, e.g., three different interfollicular regions, respectively.
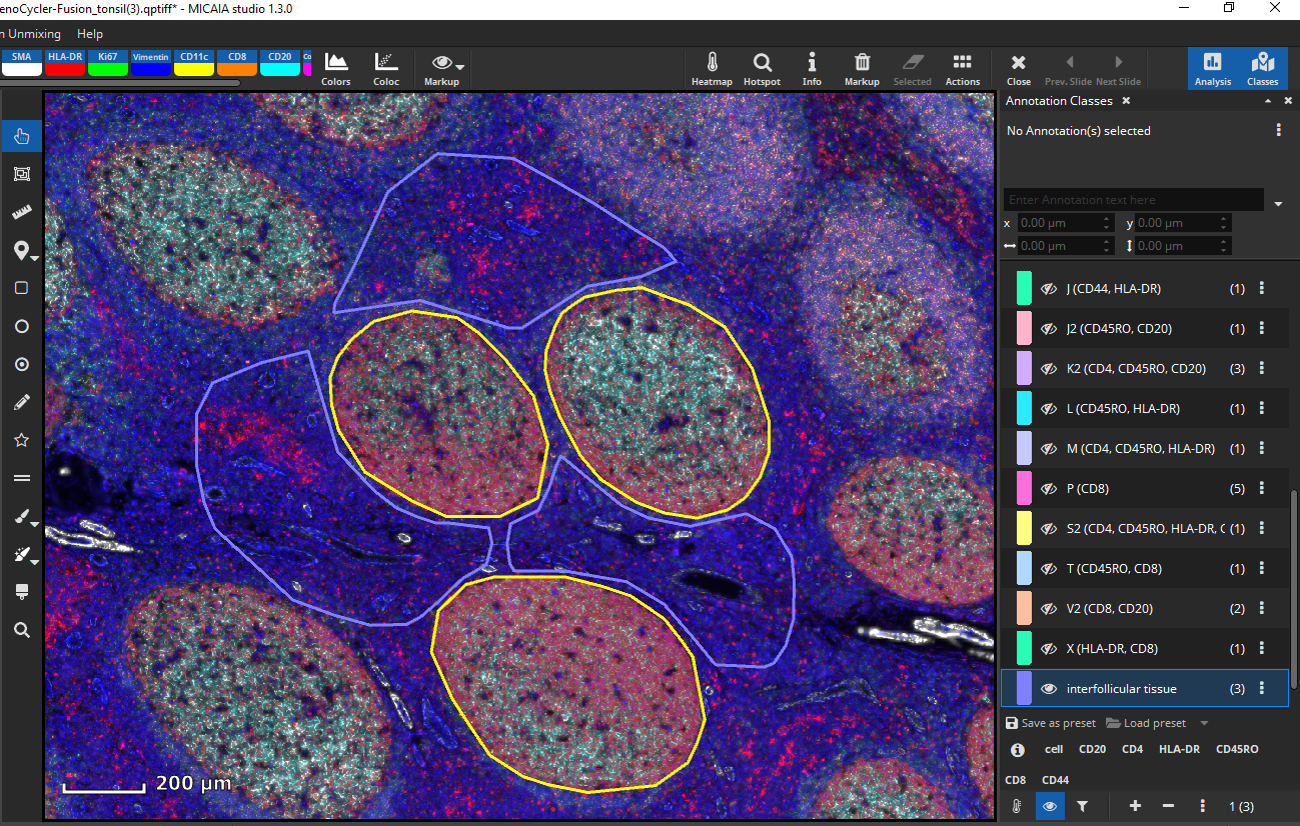
By analyzing the defined RoIs, MIKAIA will determine markers individually or it will create annotation classes based on marker expression per cell specific for interfollicular regions.
Output
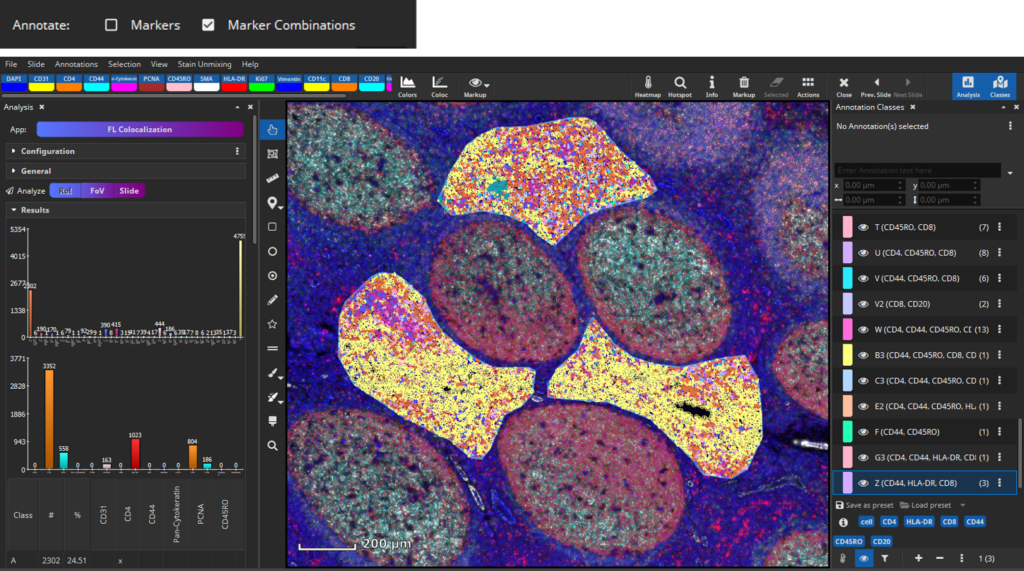
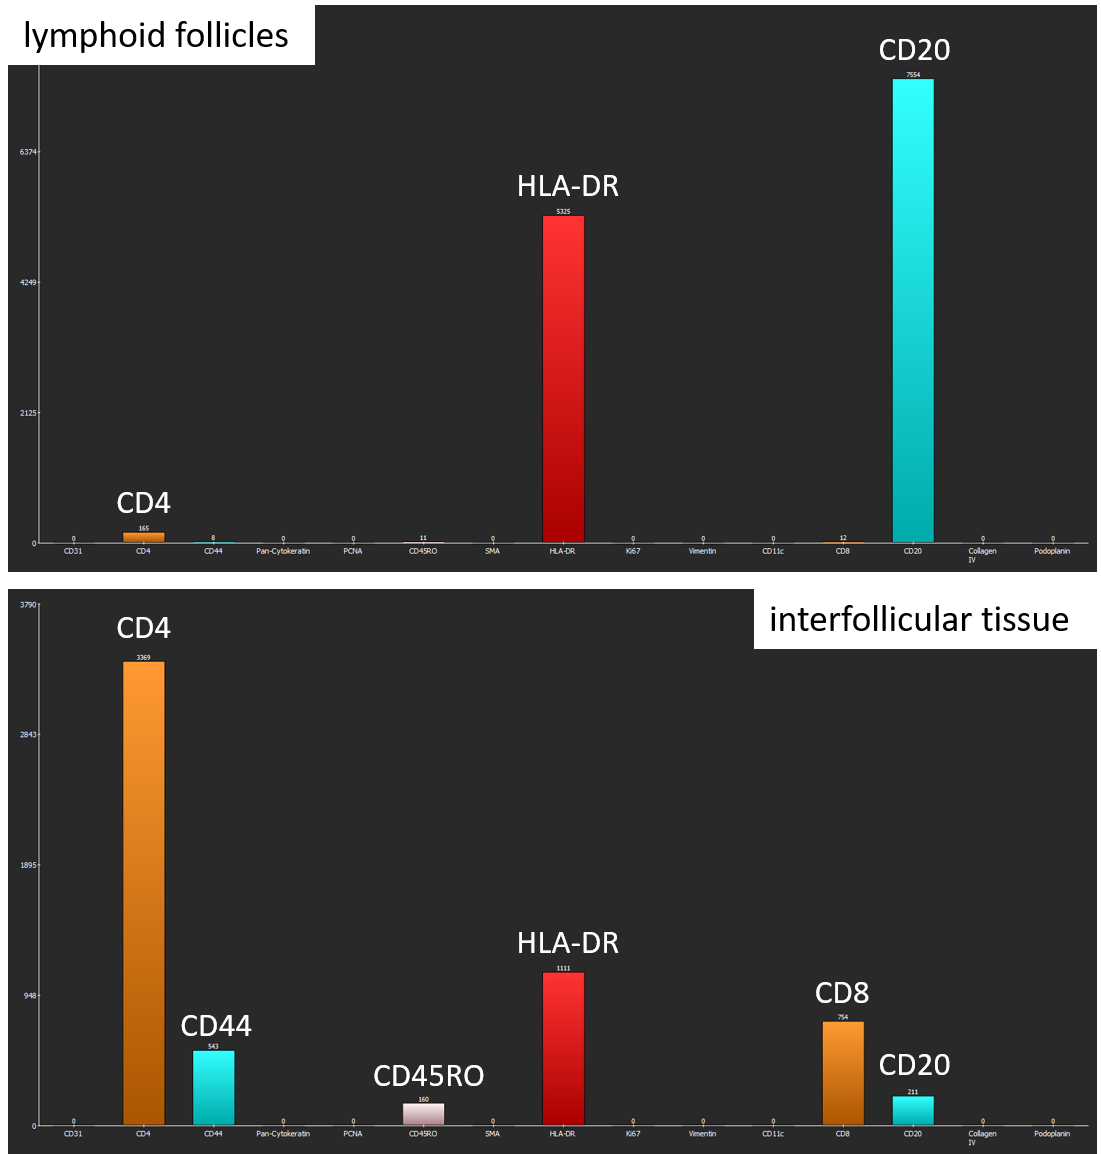
The software generates two bar diagrams of the absolute amounts of cells by marker and marker combinations as well two tables containing the absolute and relative counts. Coexpression analysis shows that lymphoid follicles mainly contain CD20+ B-cells and HLA-DR+ antigen-presenting cells. In contrast, interfollicular tissue comprises a large amount of CD4+ T-cells as well as lower amounts of HLA-DR+ antigen-presenting cells, CD8+ T-cells, CD44+ cells, CD45RO+ T-helper cells, and CD20+ B-cells.
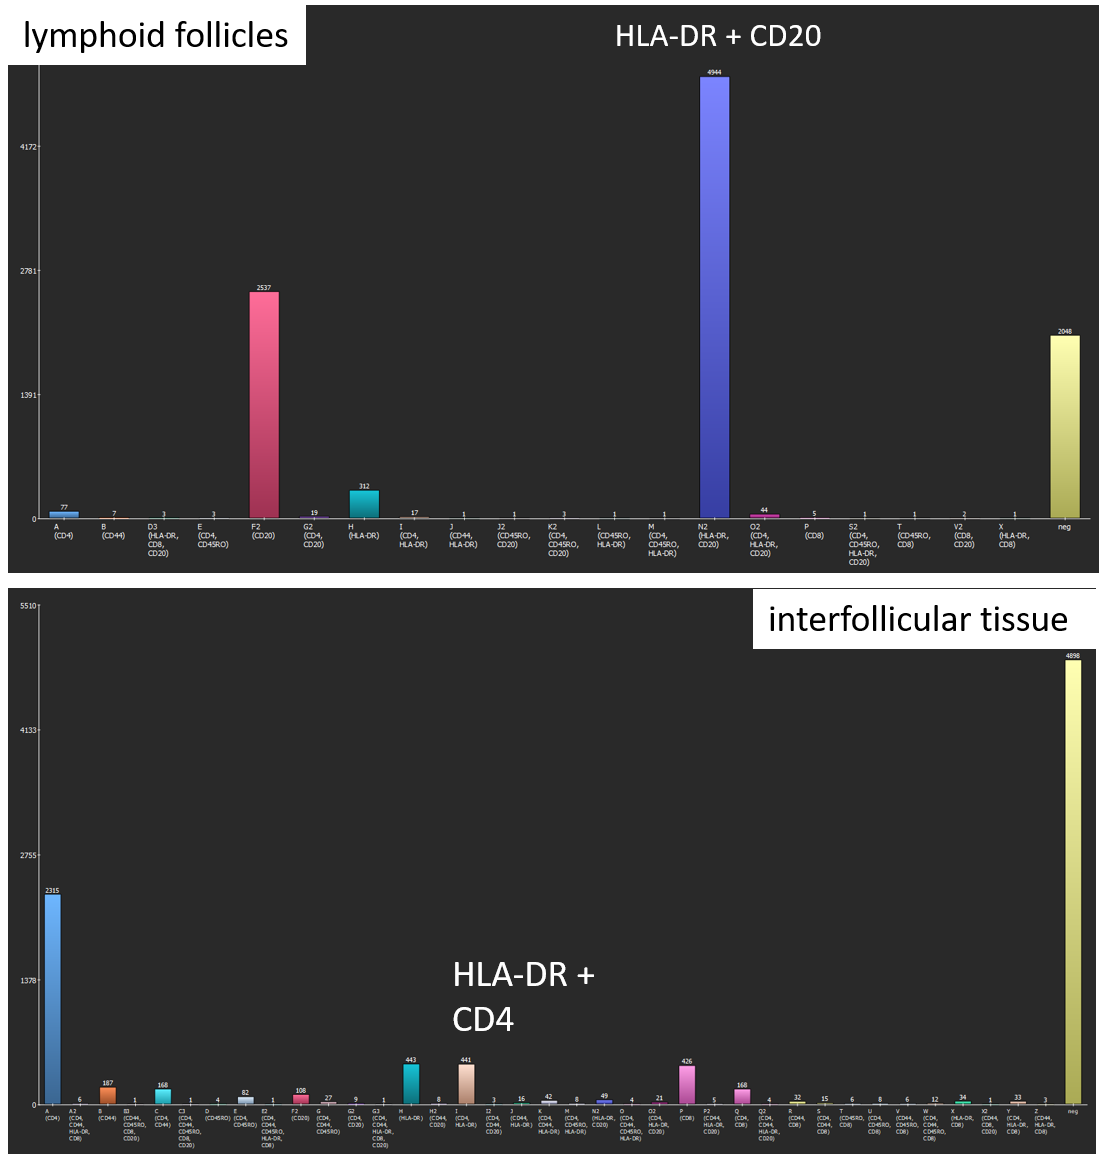
Coexpression analysis shows suitable results with regard to marker combinations. In lymphoid follicles, most cells coexpress CD20 and HLA-DR, whereas cells in the interfollicular tissue express a variety of marker combinations, for instance CD4 and HLA-DR.
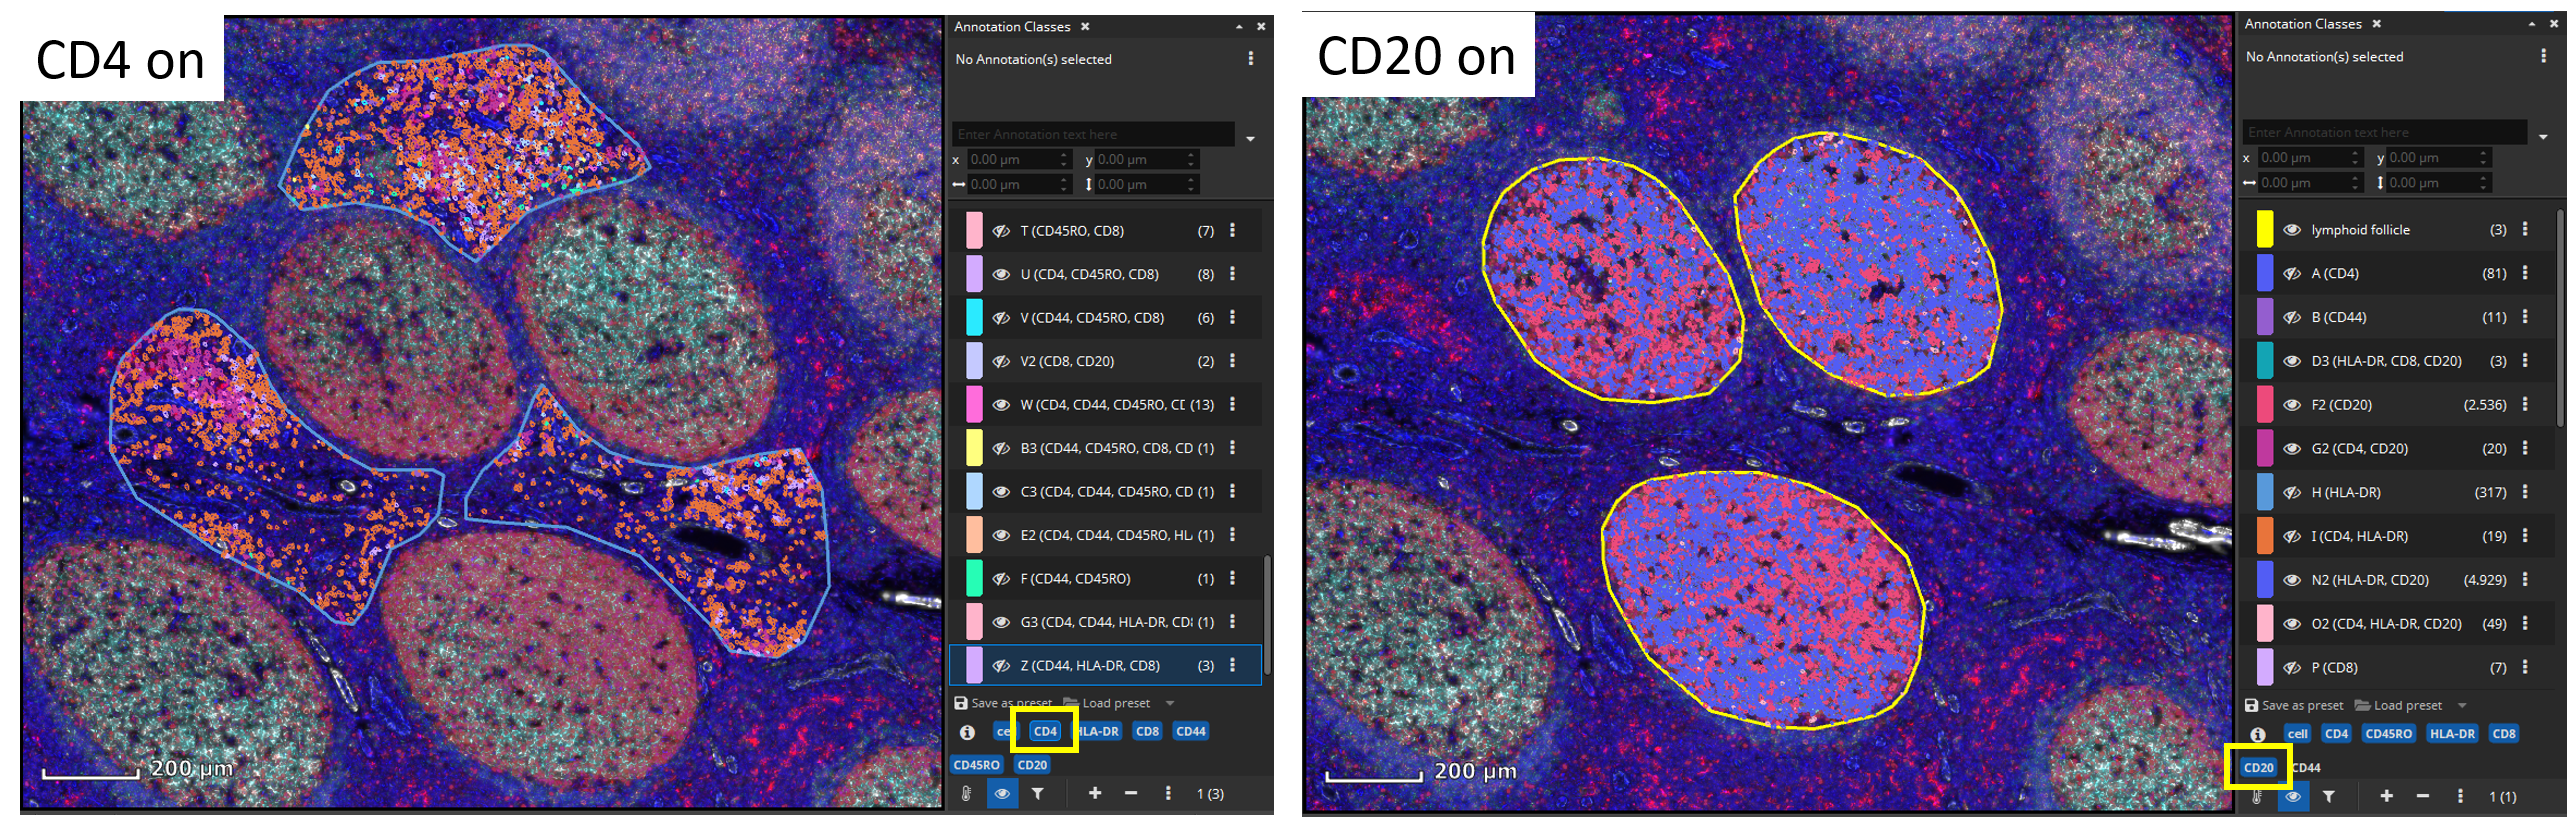
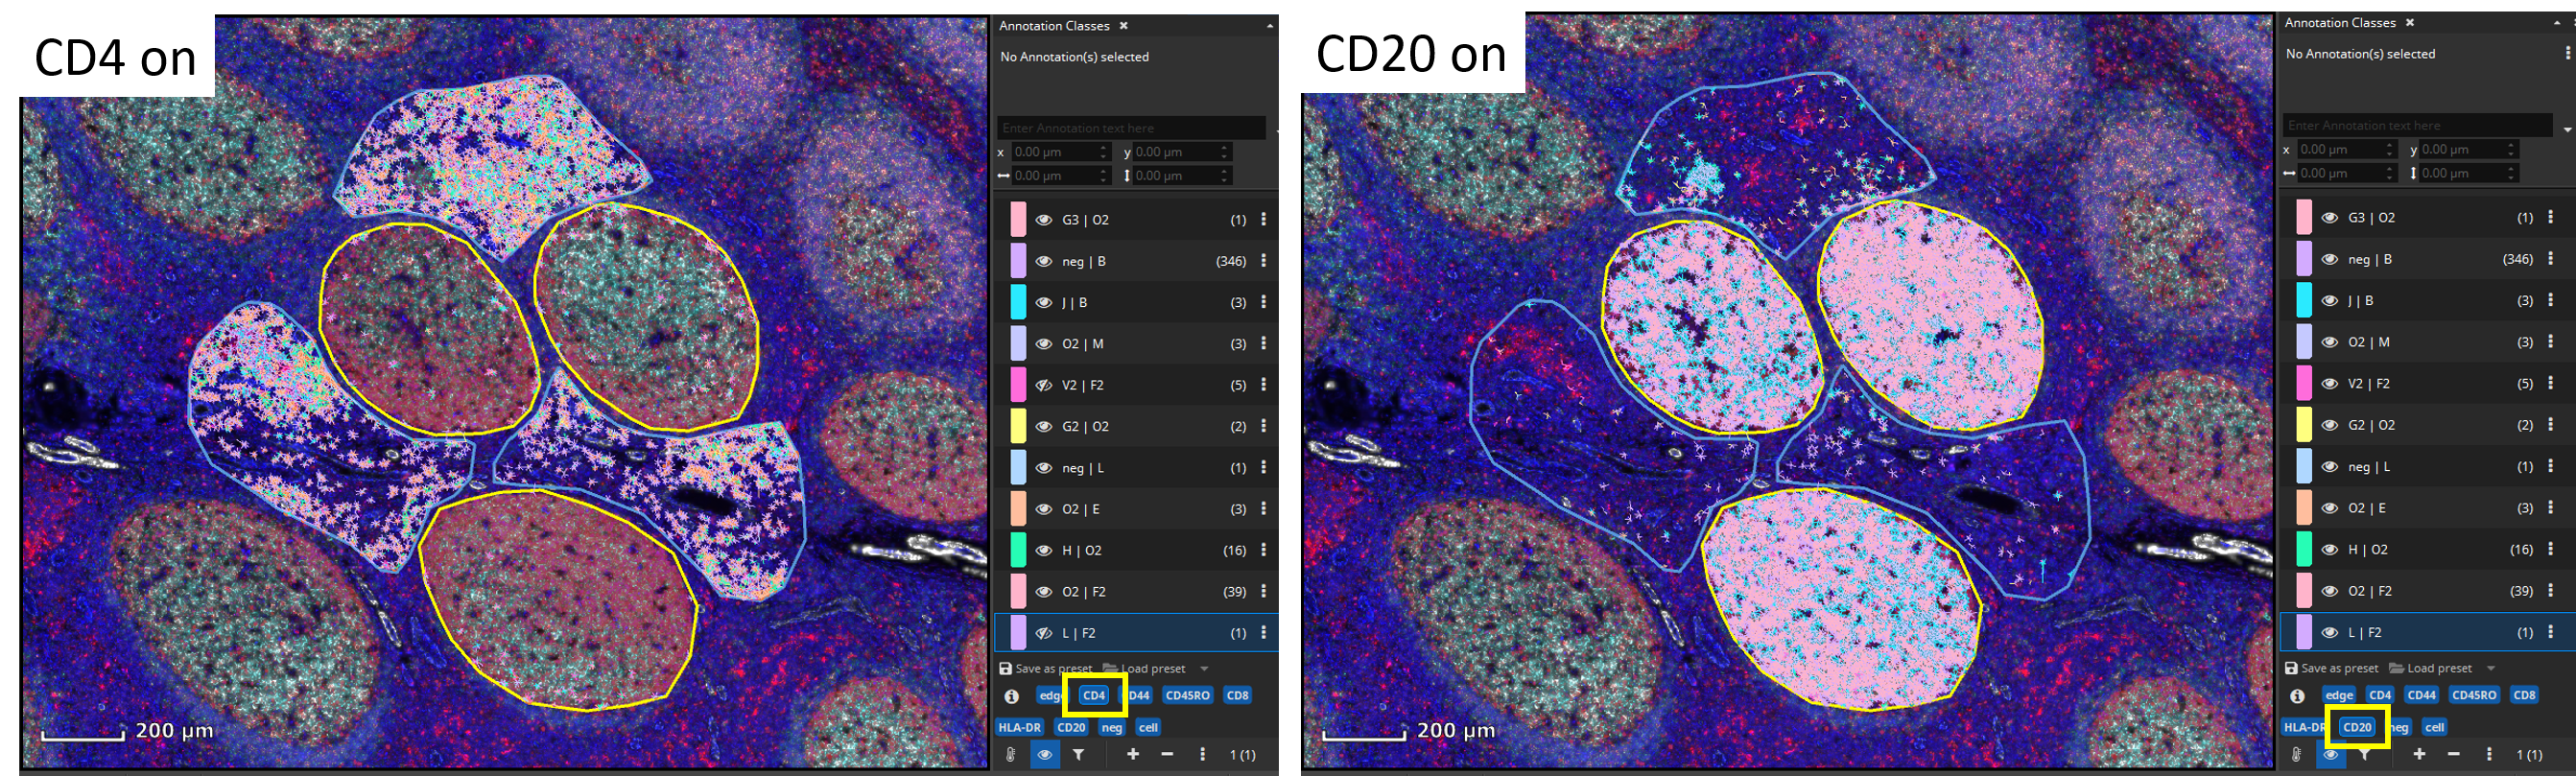
Individual cell classes as well as the whole-slide-image channels can be hidden or shown. Additionally, generated annotation classes (one per encountered marker combination) are “tagged” with marker-tags such as “CD4” or “CD20” in this example. By clicking on a blue tag button, all classes that include this marker are toggled on/off.
The markup appearances can be configured individually per class, e.g., the outline and fill color can be changed. Also, all classes’ appearances can be globally changed via the “Markup” button in the main toolbar. It allows to force outlined or filled cell annotations and the markup’s opacity can be changed. Finally, results can easily be exported into a CSV file that can be opened by Microsoft Excel or imported into R or Matlab for further statistical processing.
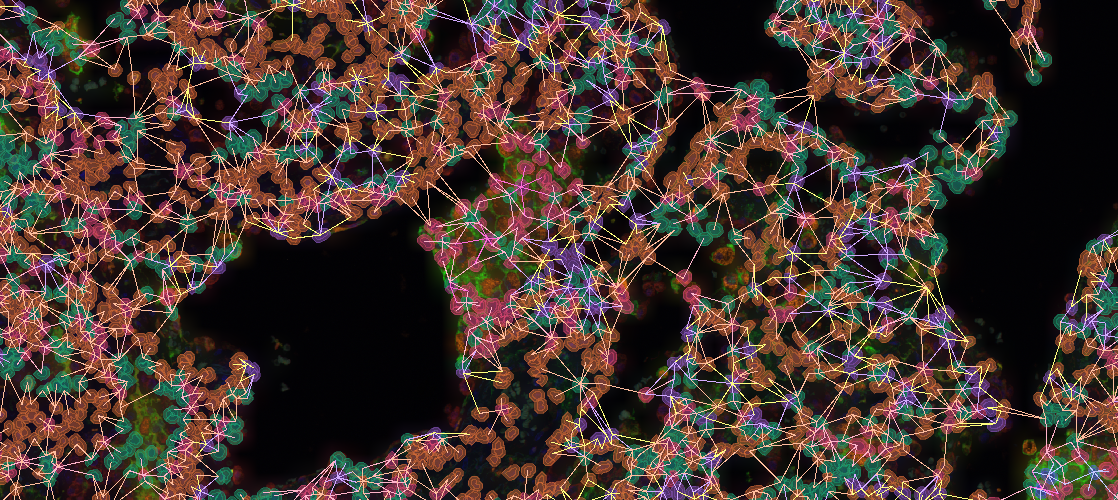
Analyzing cell-cell-interactions
In a next step, it may be worthwhile to gain insights on possible interactions between cell types. The Cell-Cell Connections App is typically run on the results produced by the FL Colocalization App. It creates an annotation for each cell-cell connection separately for markers and marker combinations.
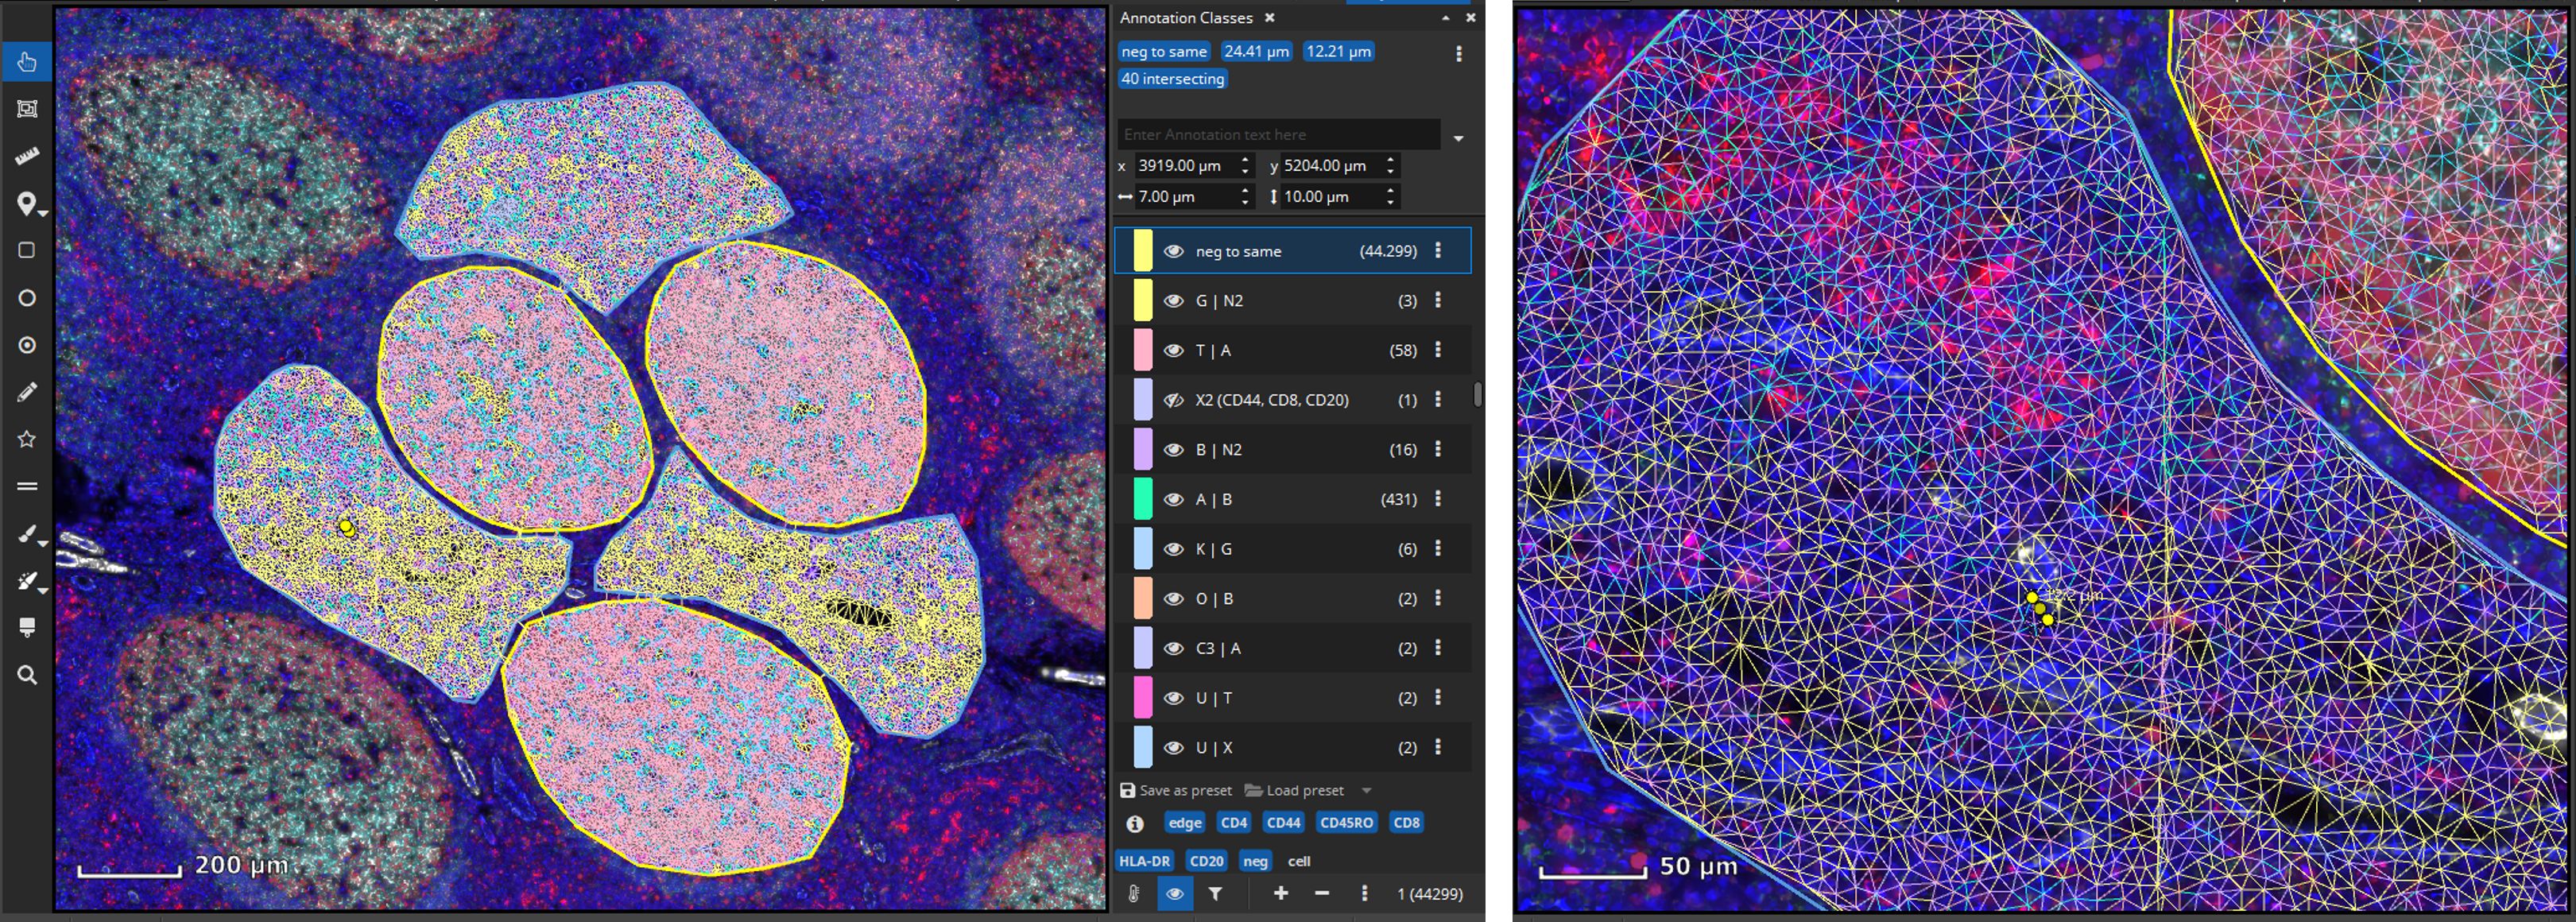
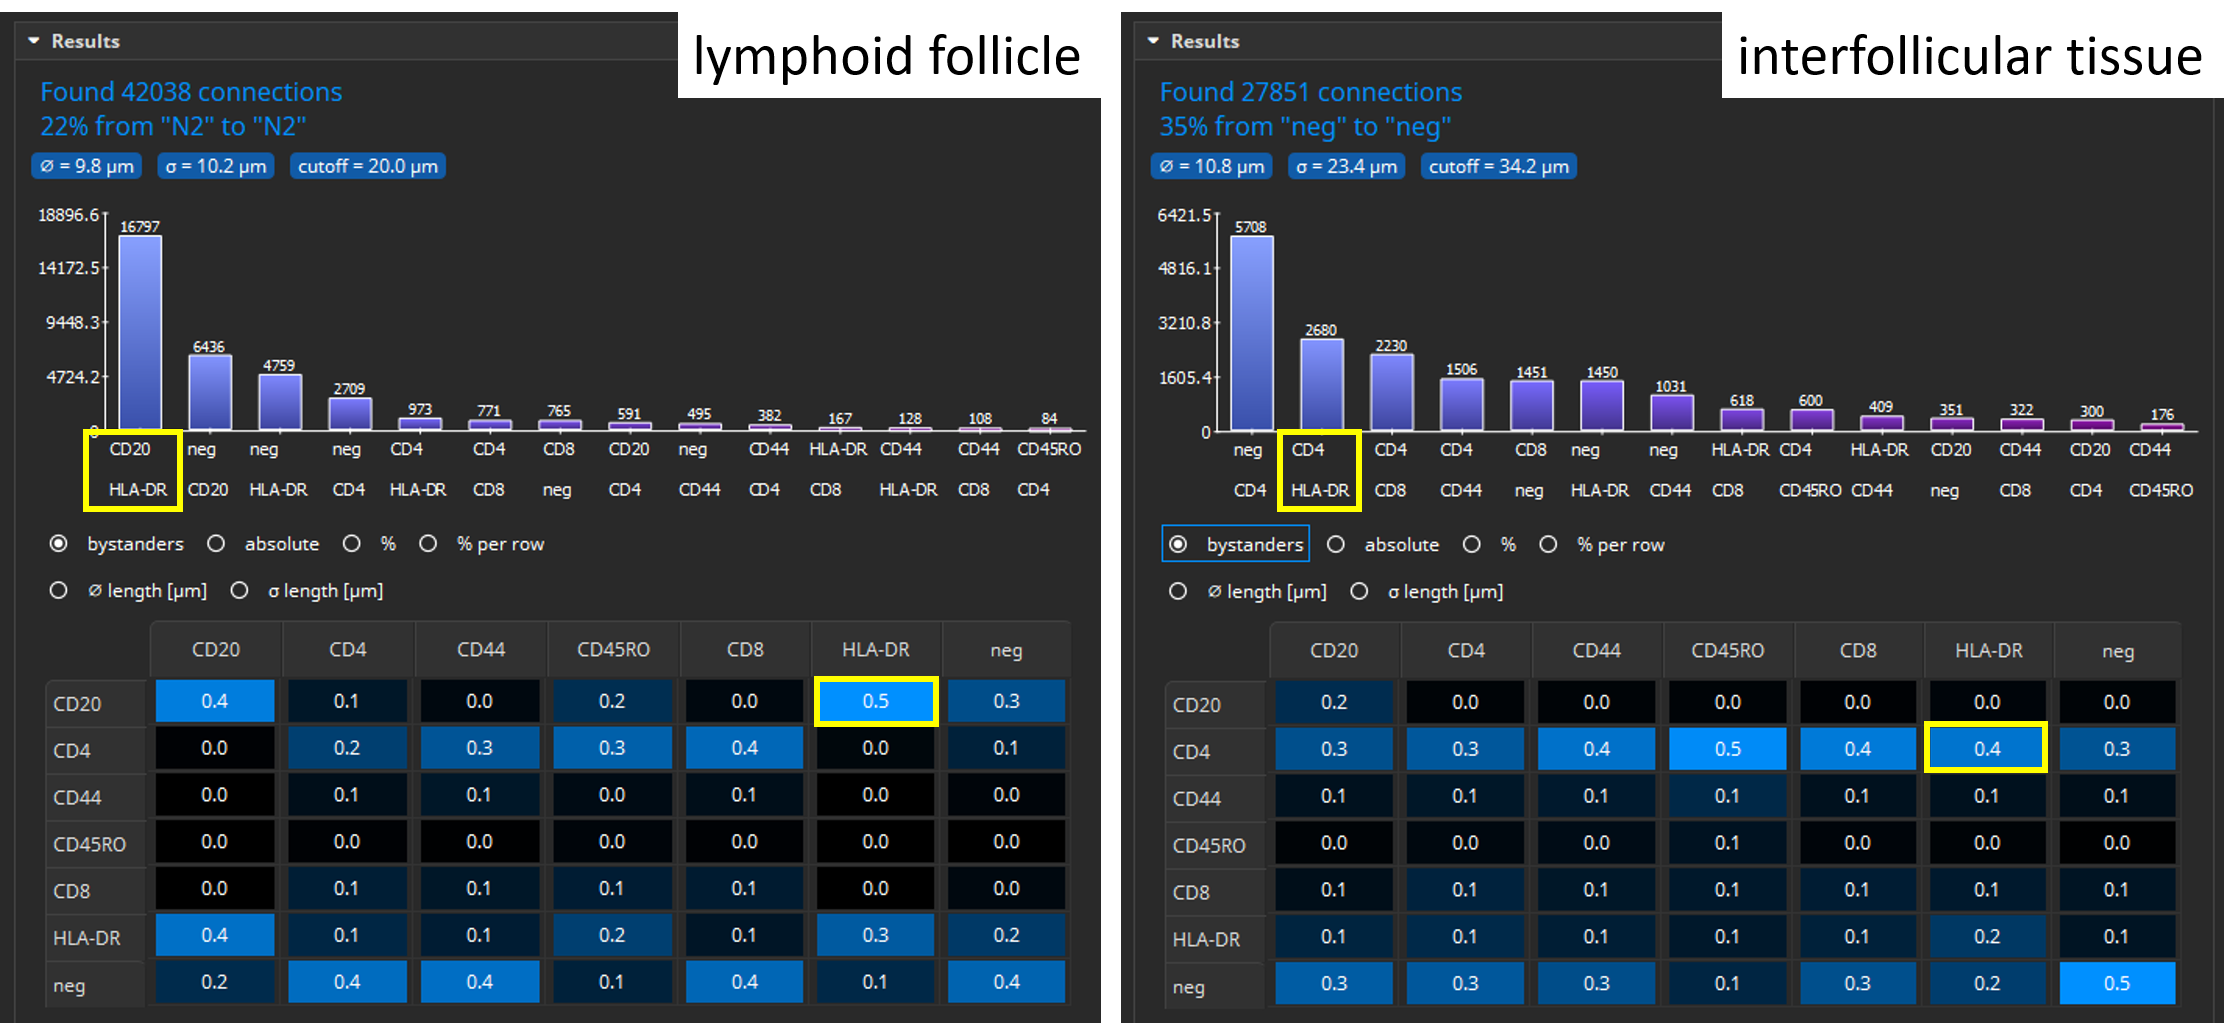
The Results pane shows a bar chart that visualizes which connection type appears most frequently. For instance, in lymphoid follicles CD20 and HLA-DR positive cells are most frequently adjacent to one another whereas in interfollicular tissue connections between CD4 and HLA-DR positive cells are most frequent. By default, only connections between cells of different types are considered, though this can be configured. Additionally, a large table shows six matrices where the various classes (cell types) are listed both in the x and y axis. The table contains statistics such as the average distance (in µm) between cell types or a bystander analysis. For instance, in lymphoid follicles CD20 has 0.5 neighbors of HLA-DR cells on average. In interfollicular tissue, CD4 has 0.4 neighbors of HLA-DR cells on average. The software also computes a histogram and table for marker combinations.
As it is demonstrated in the FL Colocalization App before, individual cell classes as well as the whole-slide-image channels can be toggled on/off by clicking marker-tags such as “CD4” or “CD20” in this example. Finally, results can easily be exported into a CSV file that can be opened by Microsoft Excel or imported into R or Matlab for further statistical processing.


Add comment