Everyone is talking about spatial biology. But what is spatial biology really? It’s an umbrella term for a new set of technologies, the most prominent ones being spatial transcriptomics and proteomics. In the past two years, many new devices were released to the market, which makes this amazing technology widely applicable by biologists, neurologists, pathologists, pharmacologists, etc. Read our Spatial Biology 101 to dive deeper into the field …
If you are not a molecular biologist, we recommend reading our Molecular Biology 101 for Techies article first.

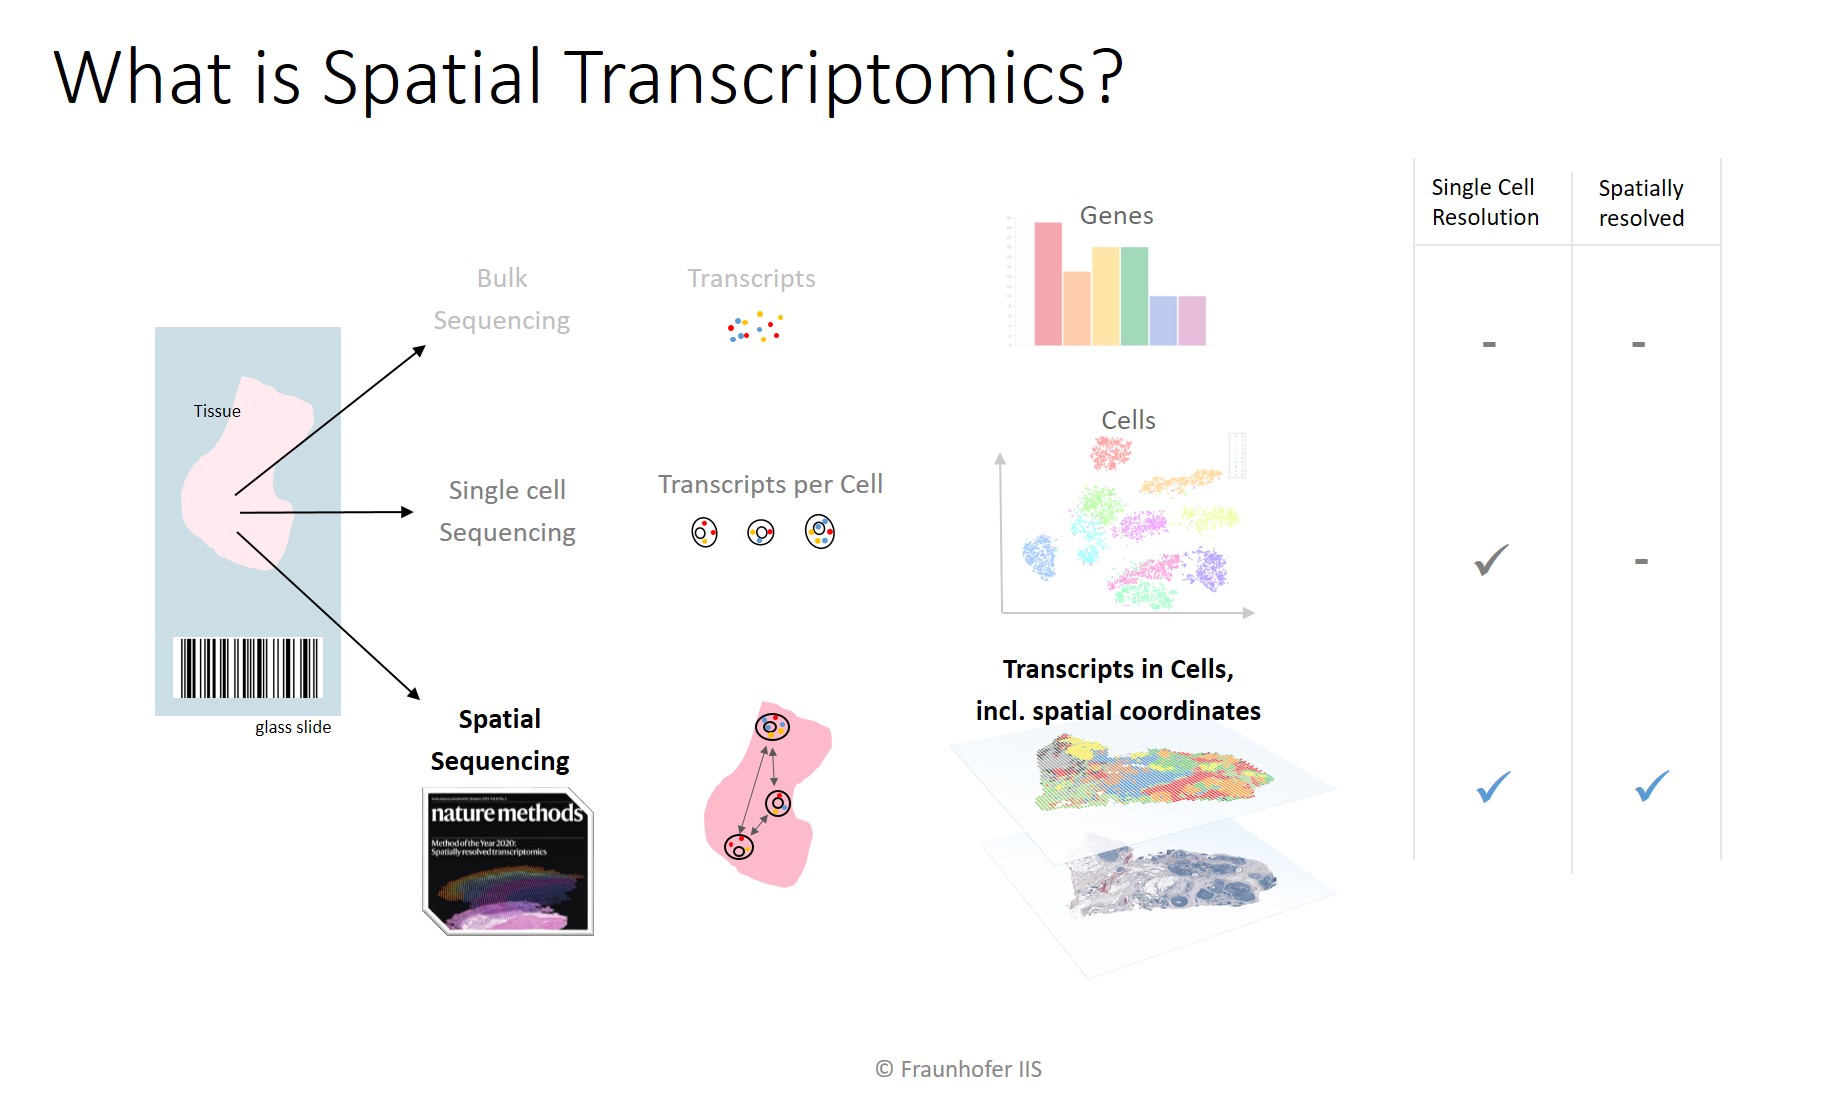
“Spatially Resolved Transcriptomics” was named the Method of the Year by Nature. To understand what “spatial” means let us look at the preceding technologies, namely bulk sequencing and single-cell sequencing.
In bulk sequencing, a collection of cells is collectively analyzed, e.g., with an Illumina sequencer. The output is the quantitative gene expression, but since many cells were mixed, the gene expression across all cells is measured. When it is for instance the goal to measure the expression of a tumor sample, it is important that the mix of cells is comprised predominantly of tumor cells, because intermingled stroma or immune cells will “pollute” the measurement.
The evolution is single cell sequencing (scRNA-Seq), where a device first makes each single cell uniquely identifiable by inserting a unique molecular identifier (UMI) that serves as a barcode. All cells can then be bulk-sequenced, but in the digital output, individual genes that stem from the same cell can be identified thanks to the inserted barcodes.
A drawback to both methods is that it is not known where in the tissue sample a particular cell originated from. Its morphology is lost and so is the information about which other cell lived in the cell’s neighborhood. This is the unique advantage of spatial biology methods. They retain the position of each cell. This enables visualizing individual genes as a markup layer on top of the scanned tissue sample.

To employ a metaphor, assume we want to find out about the individual food products and their ingredients in a supermarket. Bulk sequencing would yield the list of ingredients from all products in the market. It would inform us that the mix of all products contain sugar, carbon hydrates, vitamins, water. This is not very informative, however, since we want to find out about the ingredients of individual products. Single cell sequencing would do just that and enable us to group the measured ingredients by product. We would find out that some products contain a lot of sugar and hardly any vitamins (i.e., sweets) while others that do contain vitamins are otherwise comprised mainly of water (i.e., fruit). However, using this list, we would not be able to locate the sweets or fruits department in the market. With spatially resolved methods, we would be able to measure the ingredients for individual products and on top of that know where in the supermarket the products are located. This would enable us to pick a comparatively healthy sweet from the sweets section for our kids and pick a fruit that does not contain too many acids for our sensitive stomachs.

The figure shows the quantitative results that can be obtained by the sequencing methods. Bulk sequencing reports only the frequency of genes. Single cell sequencing allows clustering by gene expression. Combined with a dimension reduction algorithm such as PCA, UMAP, or T-SNE, cells can be visualized in a dimensionless 2D or 3D plot. The results from spatial sequencing can be visualized as an overlay on top of the scanned tissue sample. Depending on the spatial resolution, RNA data points either cover multiple cells (e.g., Visium Spatial by 10x Genomics has a resolution of 55×55 µm) or transcripts can be measured with subcellular resolution (e.g., single molecule FISH / smFISH, or Xenium in Situ by 10x Genomics).
Similar to Spatial Transcriptomics, proteomics also retain the spatial origin. The difference is that these methods visualize proteins instead of RNA transcripts. Proteomics scans are plexed images that contain one fluorescence channel per protein plus extra channels with DAPI, which shows the DNA in nuclei, and possibly an auto-fluorescence channel. These multi-channel scans are sometimes also called multi-plex, high-plex or hyper-plex scans.

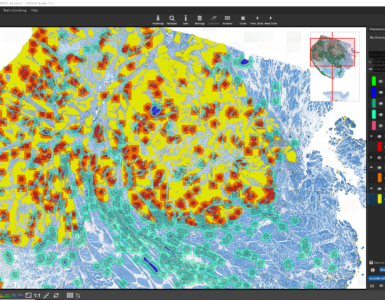
MIKAIA’s marker-wise correlation module which computes within seconds on a pixel-level the correlation between any two markers. The FL Colocalization App segments nuclei based on the DAPI channel and then classifies cells based on the protein markers’ expression levels.

The MIKAIA Cell-Cell Connection App quantifies cells’ neighborhoods by connecting each cell to their neighbor. This yields the basis for a bystander analysis (“on average cell type A has 2.6 neighbors of type B”) and a proximity analysis (“the average distance between cells of type A and B is 8,9 ± 2.3 µm”).


The figure above shows how the instruments from both spatial transcriptomics and proteomics can be categorized by the technological principles they use.
Proteomics
For proteomics, only 2 main technological categories are predominant:
- Cyclic Restaining and
- Time of Flight (ToF) Mass Spectrometry.
The major difference is that cyclic restaining instruments mark and image the set of proteins serially, i.e., in a time-multiplexed fashion. In each cycle, a small amount of proteins are stained, imaged, and then the dyes are bleached away:
stain, image, erase – stain, image, erase – stain, image, erase – …
By running multiple cycles back to back, the obtainable set of markers is virtually unlimited. The advantage is that in each cycle, the same fluorescent dyes can be re-used – let’s say 4 dyes per cycle – but they bind to different targets. The light spectrum only has to be divided into 4 sub spectra in this case, which allows minimizing the overlap between individual dyes. A drawback is that scans take very long. Commercial instruments of this category are PhenoCycler (formerly CODEX) by Akoya Biosciences, Comet by Lunaphore, MACSima by Miltenyi Biotec or CellScape by Canopy Biosciences.
Instruments based on ToF mass spectrometry, on the other hand, image all proteins in a single shot. This is possible by staining the samples with metal antibodies. These metals are then decoupled from their target protein using a very precisely focused laser beam and then measured with a mass spectrometer. In contrast to the emission wavelengths of fluorescence dyes, which form broad curves in the spectrum, these metal antibodies appear as narrow peaks in the spectrum without overlap. A larger set of up to ~40 metal antibodies can be differentiated in this way. Commercially available instruments that use this technology are for instance Hyperion CyToF by Standard Biotools (formerly by Fluidigm) or the MIBIscope by IONPATH.
Spatial Transcriptomics

The newest instrument in the 10x Genomics spatial biology portfolio, Xenium in Situ, released in December 2022, represents the In-situ sequencing (ISS) method. In contrast to ISH, where probes hybridize to an entire target gene, in ISS bases are profiled individually, 1-2 bases at a time. Fluorophores linked to the individual bases enable imaging of the bases and make the sequence readable using imaging.
The advantage of imaging based methods is that they allow for measuring a large number of RNAs at a high spatial resolution, going all the way up to subcellular resolution. A disadvantage is that high resolution imaging is required, sometimes in combination with sequential imaging and multiple focus layers. smFISH scans, for instance, are typically 5D – when cyclic staining is used, even a 6th dimension is added. Scan protocols for 6D look as follows:
- For each staining cycle
- For each field of view
- For each fluorophore
- At each focus position (z-position)
- Capture 2D image with high exposure and 16 bit dynamic range.
- At each focus position (z-position)
- For each fluorophore
- For each field of view
It becomes clear that scans not only take long (hours to days), but also produce super vast amounts of data that need to be analyzed.
Sequencing methods do not measure transcripts in place, but instead can be regarded as preprocessing steps that are followed by a regular RNA-sequencing. Commercially available array-based solutions are STOmics by BGI or Visium Spatial by 10x Genomics. Their spatial resolution varies widely with BGI’s product based on the Stereo-SEQ technology achieving sub-cellular resolution by employing micro-wells with a diameter of only 0.5 µm and Visium Spatial achieving only a near-single-cell resolution of 55×55µm per spot. A personal experience based on attending the European Spatial Biology Congress 2022 in The Hague is that despite this lower resolution, Visium Spatial is still the most widely used Spatial Biology solution to date. Reasons might well be that no expensive instrument has to be purchased — a scanner and sequencer are available in many labs anyway – and that the solution is well established, having been released already in Q4’2019.
The other sequencing method, microdissection, is based on the principle that probes are first hybridized in situ to the target tissue, and then only the areas of interest are analyzed. Which area is of interest, is defined by the user on the screen based on a brightfield or fluorescent scan. In the case of the nanoString GeoMx Digital Spatial Profiler (DSP), photo-cleavable probes are used, which can be detached from their targets using a precisely focused UV-laser. The detection oligos are then collected and can subsequently be analyzed with an Illumina sequencer or nanoString’s nCounter sequencer.
The presented solutions differ in the number of targets they can distinguish, scanning time, price, compatibility with FFPE and other attributes. For more in-depth information, we recommend reading one of these reviews:
- Moses, L., Pachter, L. Museum of spatial transcriptomics. Nat Methods 19, 534–546 (2022). https://doi.org/10.1038/s41592-022-01409-2
- Kleino I, Frolovaitė P, Suomi T, Elo LL. Computational solutions for spatial transcriptomics. Comput Struct Biotechnol J. 2022 Sep 1;20:4870-4884. doi: https://doi.org/10.1016/j.csbj.2022.08.043 . PMID: 36147664; PMCID: PMC9464853.
- Liao J, Lu X, Shao X, Zhu L, Fan X. Uncovering an Organ’s Molecular Architecture at Single-Cell Resolution by Spatially Resolved Transcriptomics. Trends Biotechnol. 2021 Jan;39(1):43-58. doi: 10.1016/j.tibtech.2020.05.006. Epub 2020 Jun 3. PMID: 32505359.
- Strell, C., Hilscher, M.M., Laxman, N., Svedlund, J., Wu, C., Yokota, C. and Nilsson, M. (2019), Placing RNA in context and space – methods for spatially resolved transcriptomics. FEBS J, 286: 1468-1481. https://doi.org/10.1111/febs.14435


Add comment