
FAMIUM SAND is an analytics tool for content providers to monitor the performance of their streaming services. What makes SAND stand out from other analytics tools is its debugging-oriented design and in this two-part blog post, we are going to show you exactly what we mean via three concrete examples.
If you’re not yet familiar with FAMIUM SAND, check out Why OTT content providers should use FAMIUM SAND to monitor the streaming sessions of their customers or dive right in with SAND Dashboards: The Full Tour.
3 Ways to Locate Streaming Errors and Understand What Caused Them
1. Start with the Errors Overview Dashboard
Because SAND is a debugging tool, it has many Error dashboards. These are a great place to understand the error landscape of the streaming service. For example, the Errors Overview dashboard shows which errors were thrown during streaming, which devices or platforms were affected and makes their count and severity clear at a first glance.
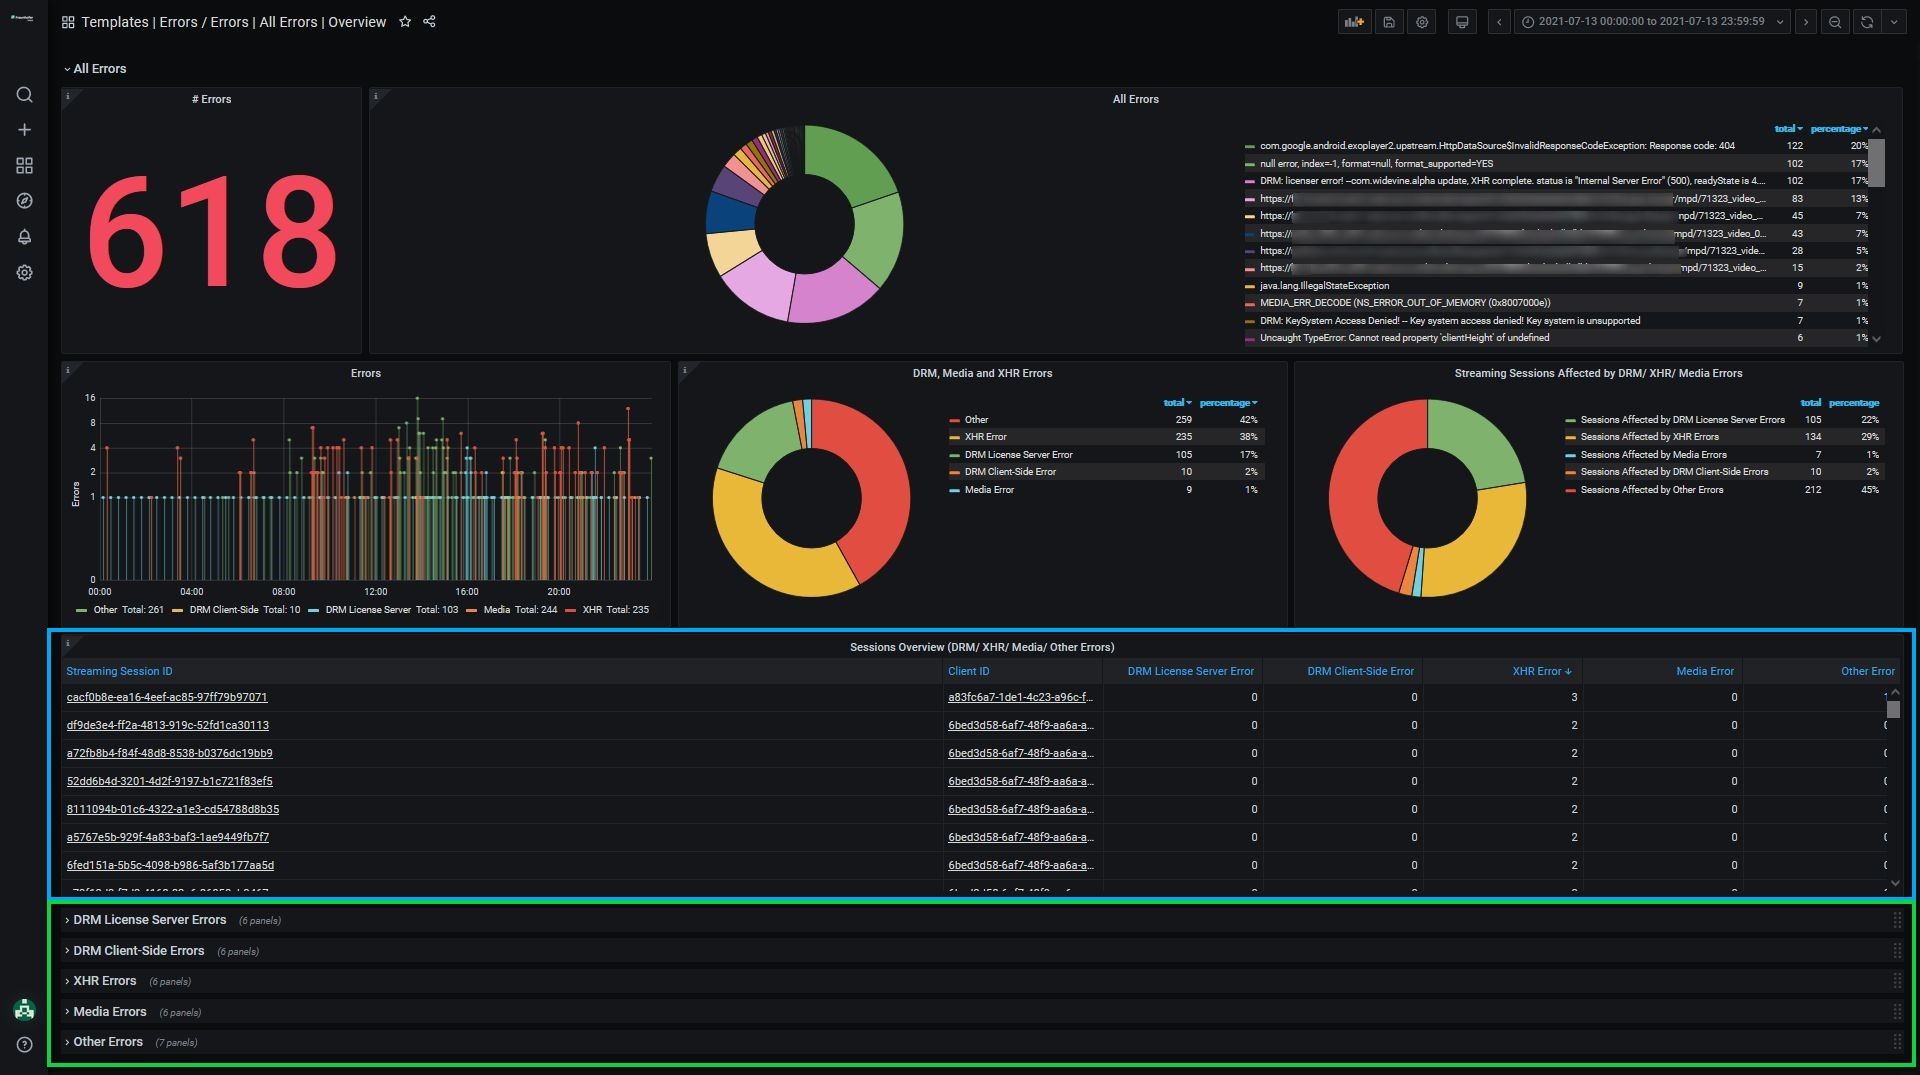
At Fraunhofer FOKUS, we know first-hand that error names are often cryptic. We also know that not all errors are created equal – some are critical, others not. So, to better support our customers, we categorize the errors we find most serious into 4 groups: DRM License-Server Errors, DRM Client-Side Errors, Media Errors and HTTP Errors (called XHR Errors in the image above). Furthermore, because streaming technologies are constantly evolving and new errors are always appearing, we too are continuously updating our categories.
To get a better sense of which streaming sessions have been affected by serious errors, take a look at the Session Overview table (blue) or open the error subsections (green).
Option A: Check the Session Overview Table
By clicking on the column labels, columns can be sorted in ascending or descending order. During sorting, if a streaming session stands out for having many serious errors linked to it, we encourage you to click on it to inspect it in the Session Details dashboard.
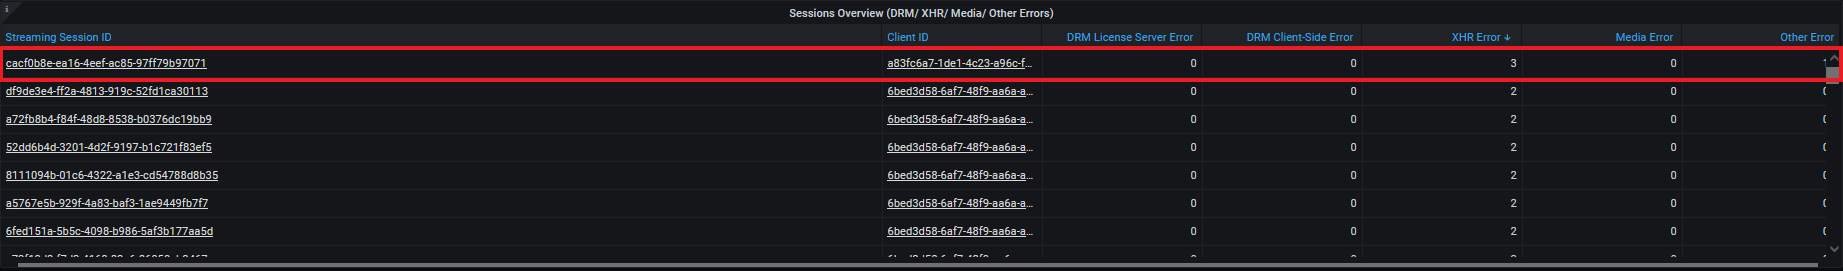
For example, streaming session cacf0b8e-ea16-4eef-ac85-97ff79b97071 threw three XHR errors. Upon closer inspection in the Session Details dashboard, we observe that the XHR errors were thrown in close succession around 09:47:17 and that there was additionally a non-critical error thrown at the start of the session.

Zooming in on the timeline or Error graph reveals even more granular time series information about the XHR errors. Hovering over the error will display the complete error name.
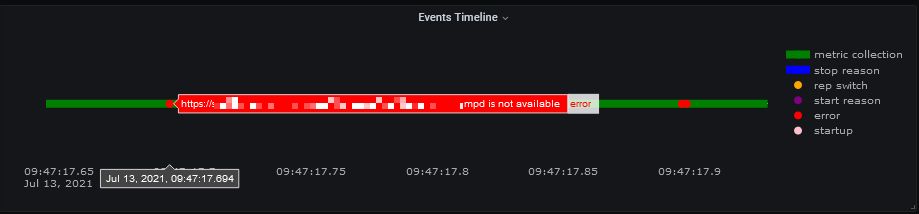
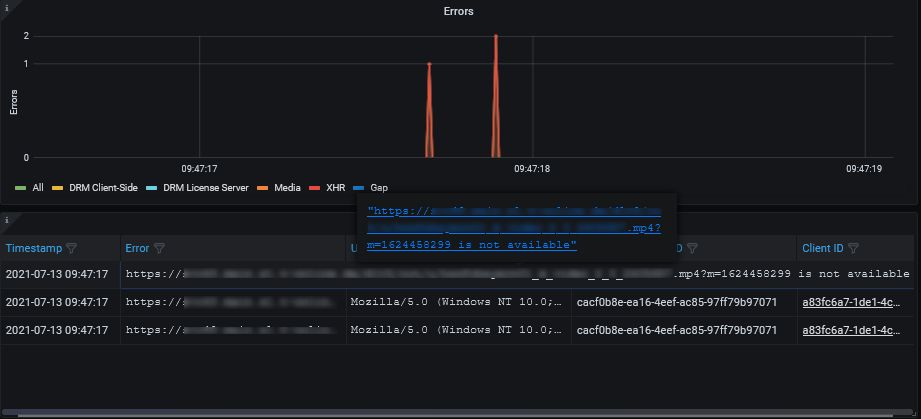
Based on the error names, we can speculate that there is a problem fetching the files (mpd and mp4) for streaming.
- https://***.mp4?m=1624458299 is not available
- https://***.mp4?m=1624458299 is not available
- https://***.mpd is not available
The error codes in the HTTP Transaction table provide some more hints. Around the time of the XHR errors, 0 error codes were reported (the status code for undefined errors), but some seconds after, 200 error codes are reported once again. This suggests that the problem fetching the files was resolved. A temporary problem fetching the files means that the URL links in themselves were not the problem.
Something that stood out the moment we opened the Session Details page is the high number of rep switches displayed on the Timeline. This is reflected in the bitrate fluctuations shown in the Bitrate graph. This observation, together with the deductions made so far, suggests that the XHR errors may have been caused by Internet connectivity issues on the side of the client. Let’s check the graphs to see if this is a reasonable assumption.
By clicking on the relevant labels in the different graphs, we can hide some data points and focus on the video metrics that interest us in the Bitrate and Buffer Level graphs, as well as the rep switches on the Timeline.
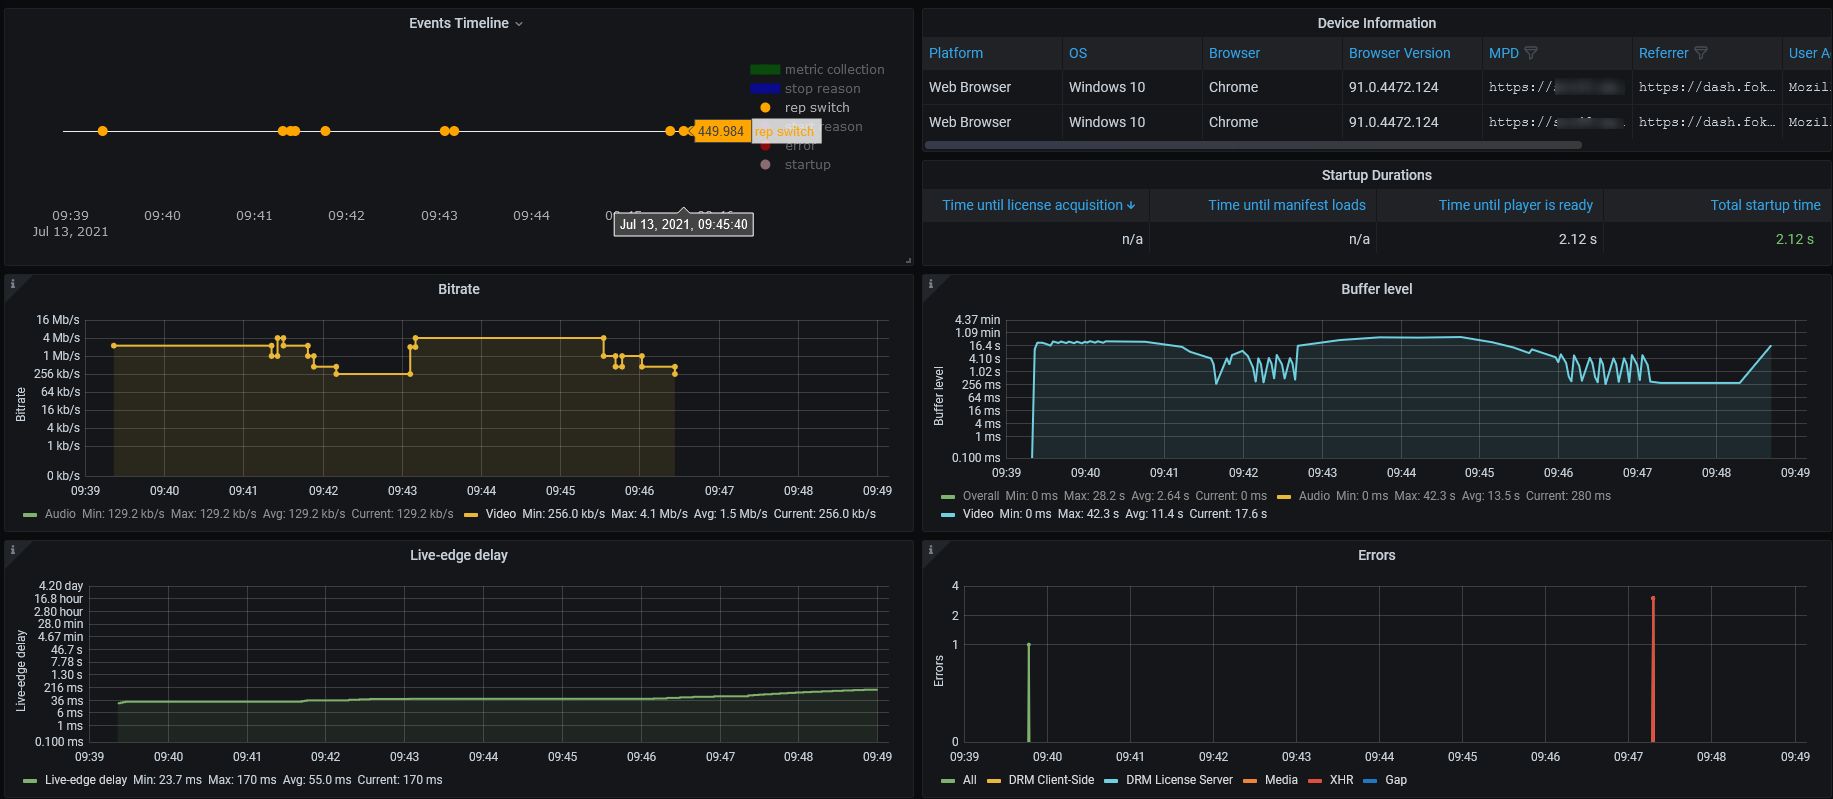
As one would expect, the changes in the bitrate coincide with the rep switches from the timeline. The last timeline rep switch was to 449 and the last bitrate was 256 kb/s. Neither value is particularly high, suggesting weak bandwidth. Each time there is bitrate fluctuation we also see drops in the buffer level, suggesting that the video is being read from the buffer faster than the buffer can fetch the next video segments. Lastly, the live-edge delay starts slowing increasing around the time of the XHR errors, further supporting our theory that weak Internet is compromised streaming. We can be fairly confident that our internet connectivity hypothesis stands.
Option B: Check the XHR Subsection in the Errors Overview Dashboard
Rather than jump directly into a streaming session from the Session Overview table, some users might prefer to check which errors are the most common and then investigate those in more detail.
The XHR subsection in the Errors Overview dashboard reveals that the errors investigated in Option A only constitute an inconsequential number of XHR errors.
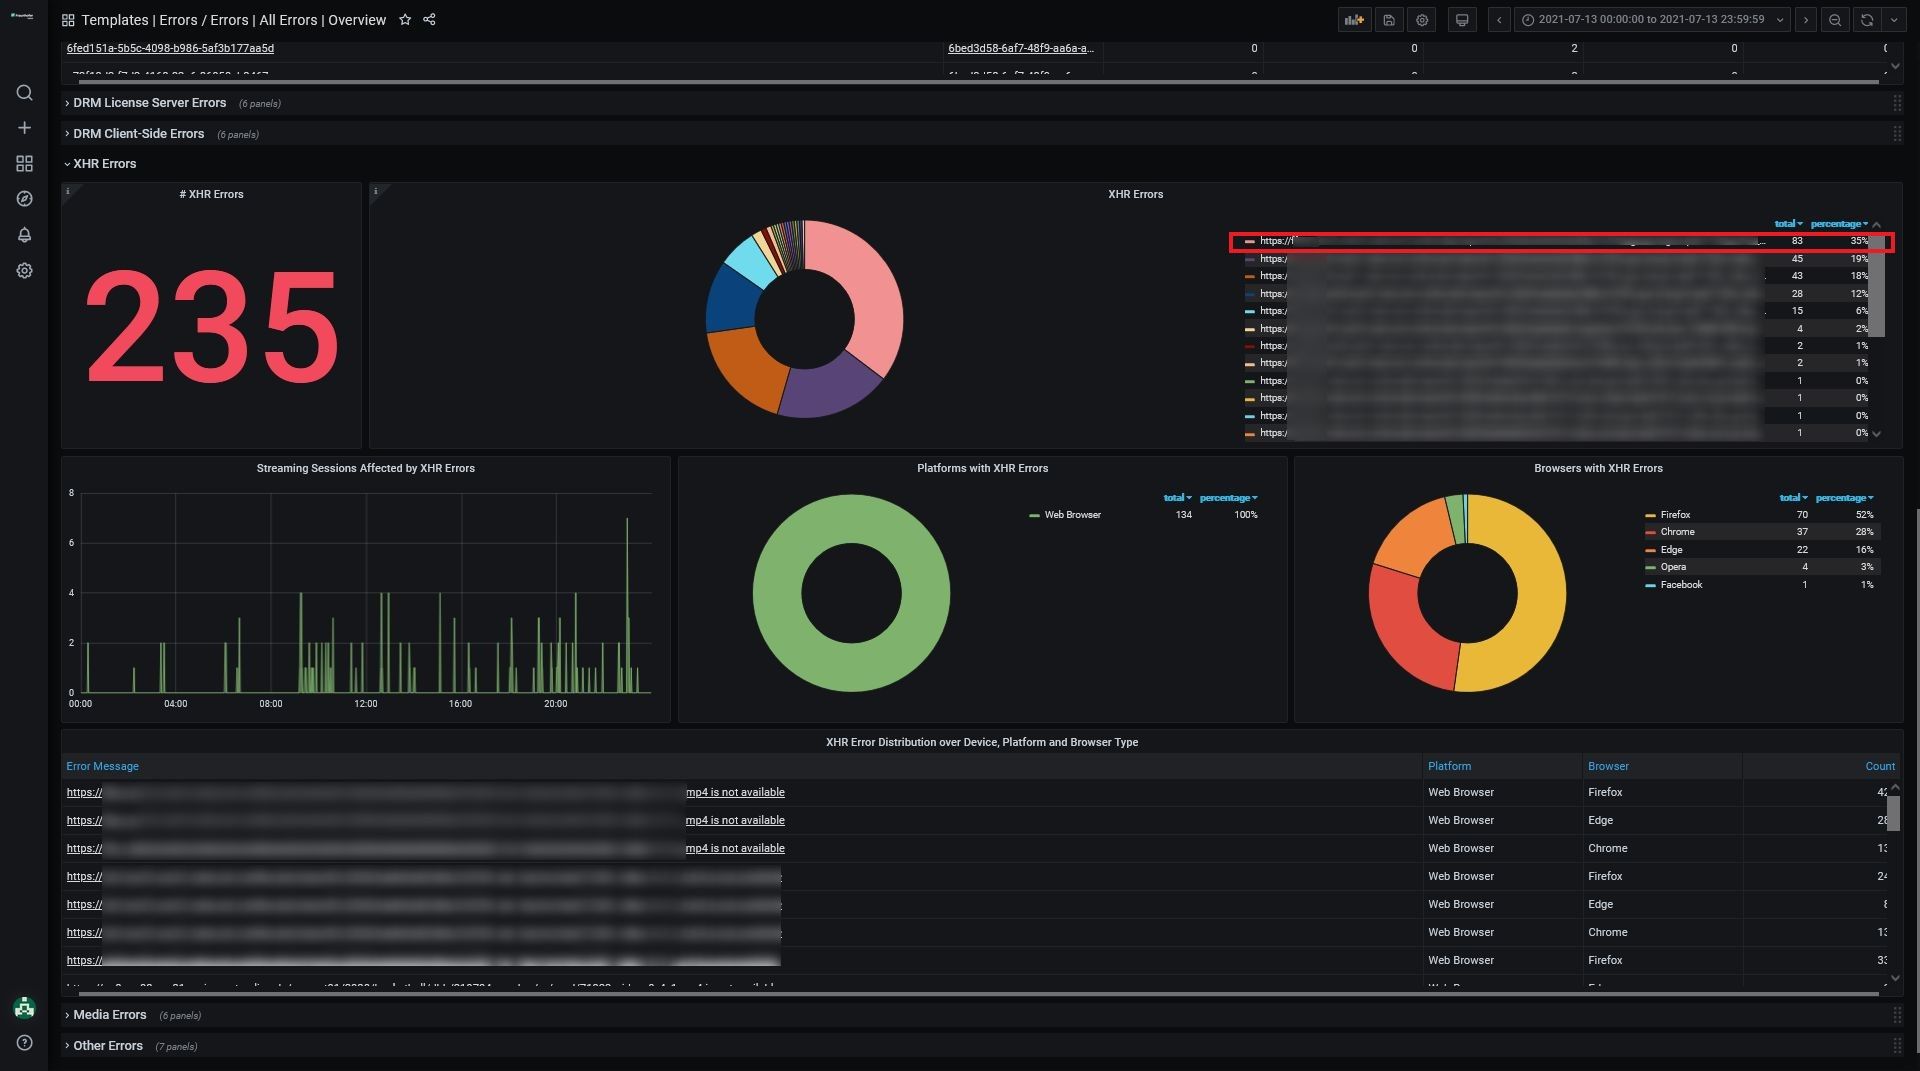
Contrastingly, the first error https://***.mp4 is not available is far more frequent error, making up 35% of all thrown XHR errors.
The name of the error suggests that similarly to the error investigated in Option A, this error results from a problem with fetching the streaming content. A click on the error name automatically opens the XHR tabular dashboard. Here all XHR errors are listed and we can use column filters to filter for the error name we are interested in.
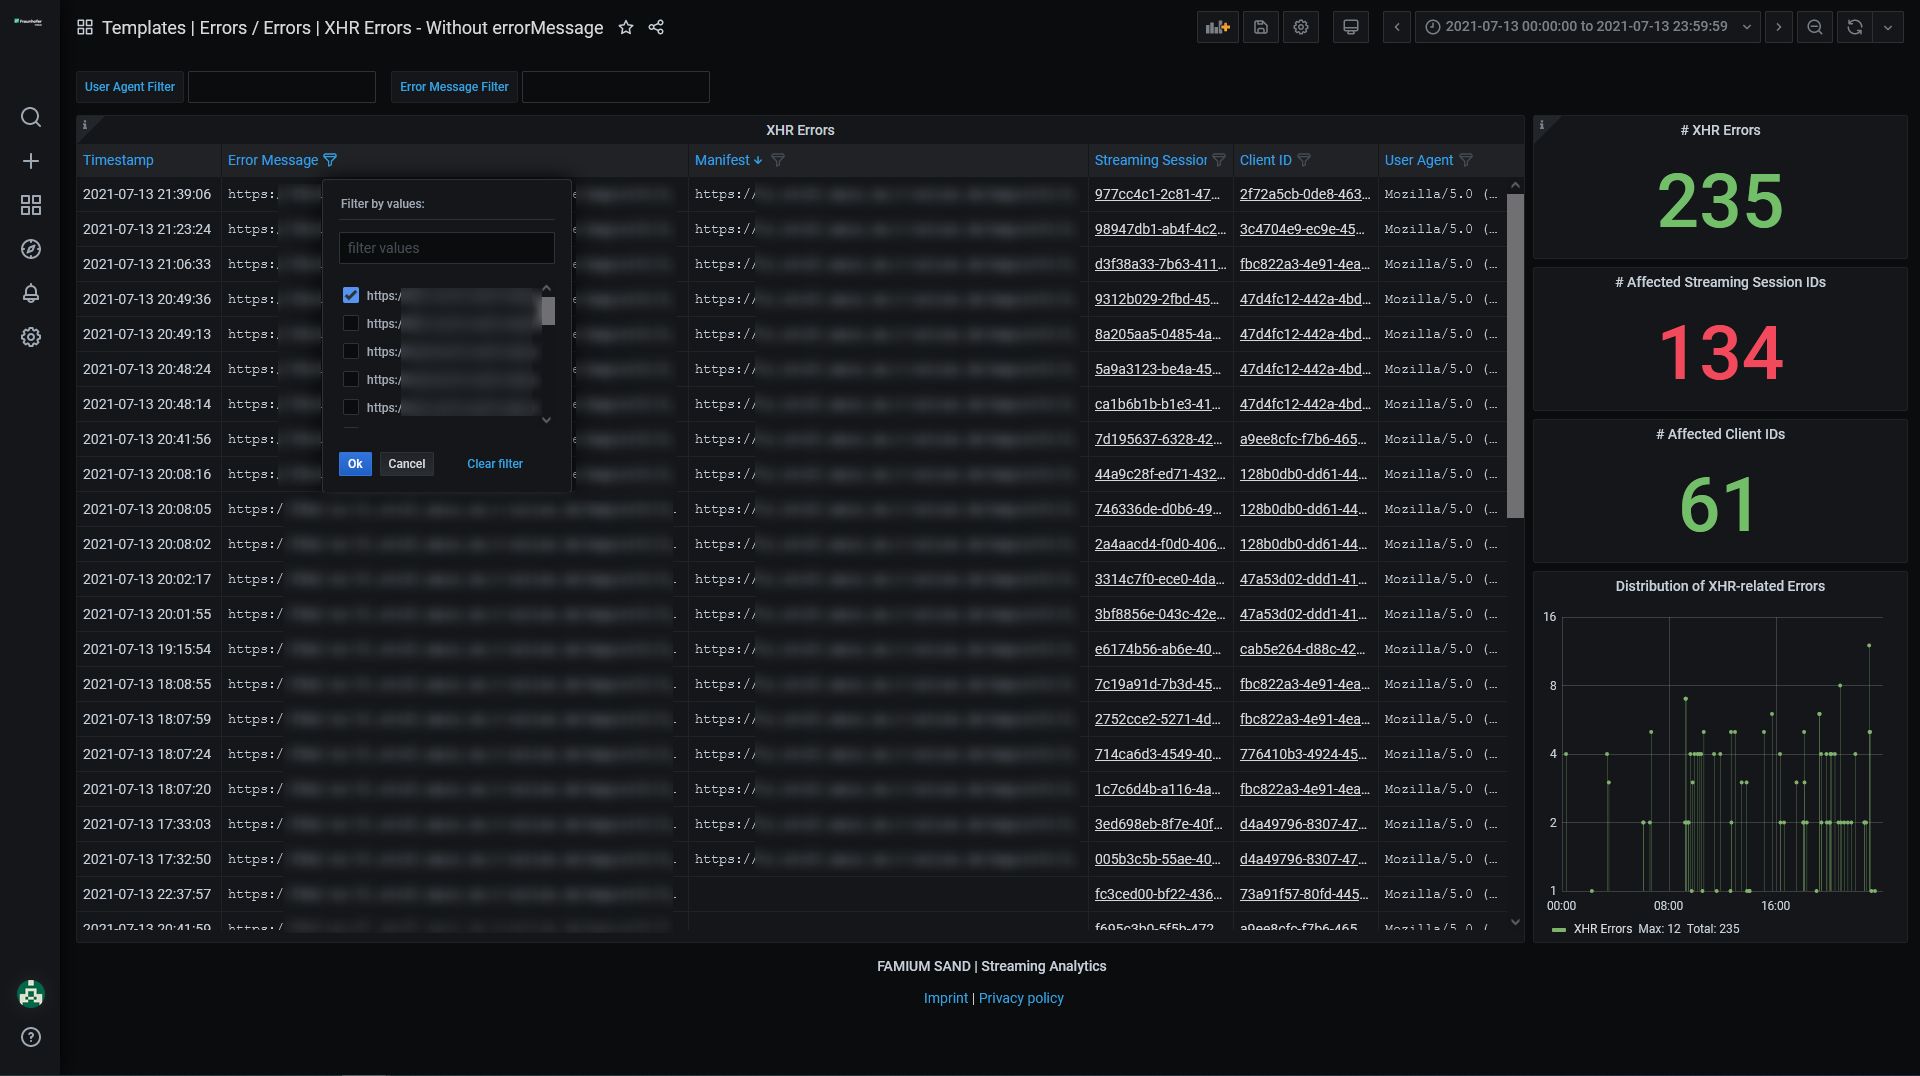
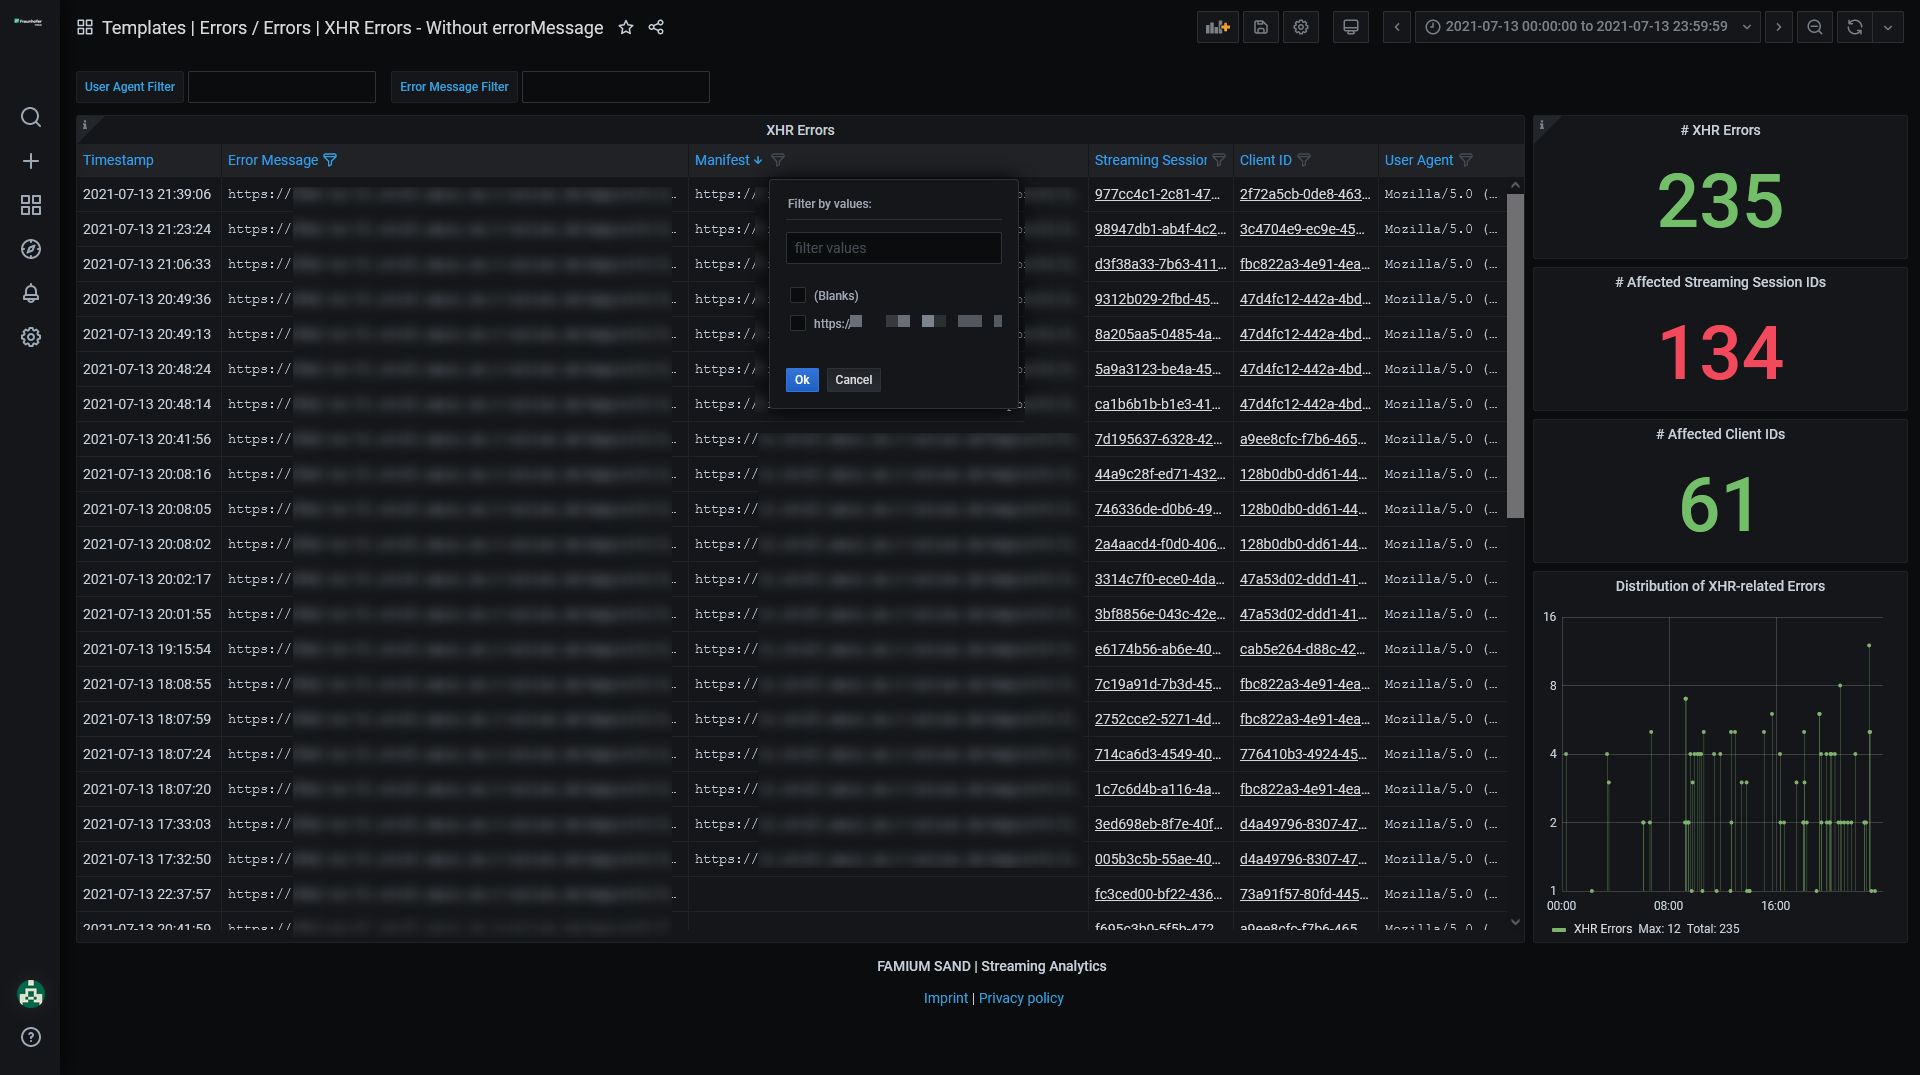
Then we can check which manifest URLs are linked to the error. There is only one.
If we sort the client column in ascending order, we can see if some clients are affected more frequently than others. These clients probably have internet connectivity issues.

To check this hypothesis, we could inspect one streaming session from each of the affected clients using the Session Details dashboard, as was done in Option A.
Summary
In this part, we have demonstrated two ways to debug errors using the Errors Overview dashboard. The first way involved checking the Session Overview table and the second involved checking the error subsections. In the first case, we identified a specific session we wanted to investigate, discovered what exact errors affected it and deduced the cause of the errors. In the second case, we quickly identified a specific error that was common to many streaming sessions and then narrowed down which streaming sessions were affected by it. These streaming sessions could then be inspected individually to identify the causes of errors. The fact that both approaches can be taken using the Errors Overview dashboards speaks to its versatility.
To see two other examples of how errors can be debugged, stay tuned for Part 2 of this blog post.