
Welcome to the first blog post of our latest series „SAND“! Here we will introduce our solution „FAMIUM SAND“ by explaining what it is and why it’s important, especially for content providers. We’ll keep our discussion high-level, but if you are interested in a more technical exploration of SAND technology, stay tuned for other posts in this series.
What is FAMIUM SAND?
To understand FAMIUM SAND, we need to first unpack these two acronyms: FAMIUM and SAND.
- FAMIUM, put very simply, is an umbrella term for technology developed at Future Applications and Media (FAME), a FOKUS business unit.
- SAND stands for Server and Network Assisted DASH. It’s a standard, specified in ISO/IEC 23009-5, to enhance streaming experience and improve network bandwidth utilization. In essence, SAND defines a standard way for clients (e.g. video players on websites), servers (e.g. CDNs) and networks (e.g. the Internet and its components) to communicate with each other. Per SAND specifications, clients, servers and networks should exchange real-time status information, for example network metrics (e.g. bandwidth) and video-player metrics (e.g. buffer level, timestamp of errors, etc.).
At FAME, we have developed technologies that (1) report metrics from DASH and HLS streams in a SAND-compliant format and (2) store the metric information in a database. These technologies are bundled as our FAMIUM SAND solution.
But what does that actually mean? What does FAMIUM SAND do?
FAMIUM SAND processes streaming data to generate meaningful insights about streaming performance and behavior, and visualizes the information on user-friendly dashboards. It can digest up to a billion metrics per day and handle hundreds of thousands of concurrent streams. That means the dashboards display real-time data!
Furthermore, because of FAMIUM SAND’s storing capabilities, one can look back on streaming sessions that happened weeks, months, even years ago. This enables mid- and long-term analysis of streaming performance, too.
What’s so great about FAMIUM SAND anyway?
Now you know what FAMIUM SAND is, but you are probably still wondering why it’s important: FAMIUM SAND is the solution for content providers, who are interested in monitoring and analyzing the performance of their streaming services.
FAMIUM SAND is an on-premise solution that allows for both real-time monitoring and long-term analysis. With it, content providers have access to in-depth streaming session data and this empowers them to better understand their customers’ viewing habits and preferences, identify and resolve problems, optimize workflows and, ultimately, guarantee a higher quality-of-experience to their customers.
To better grasp the value of FAMIUM SAND, let’s take a sneak-peak at some of our dashboards. For a full tour of our dashboards, sign up to our newsletter and receive the next blog post in this series!
Real-Time Monitoring
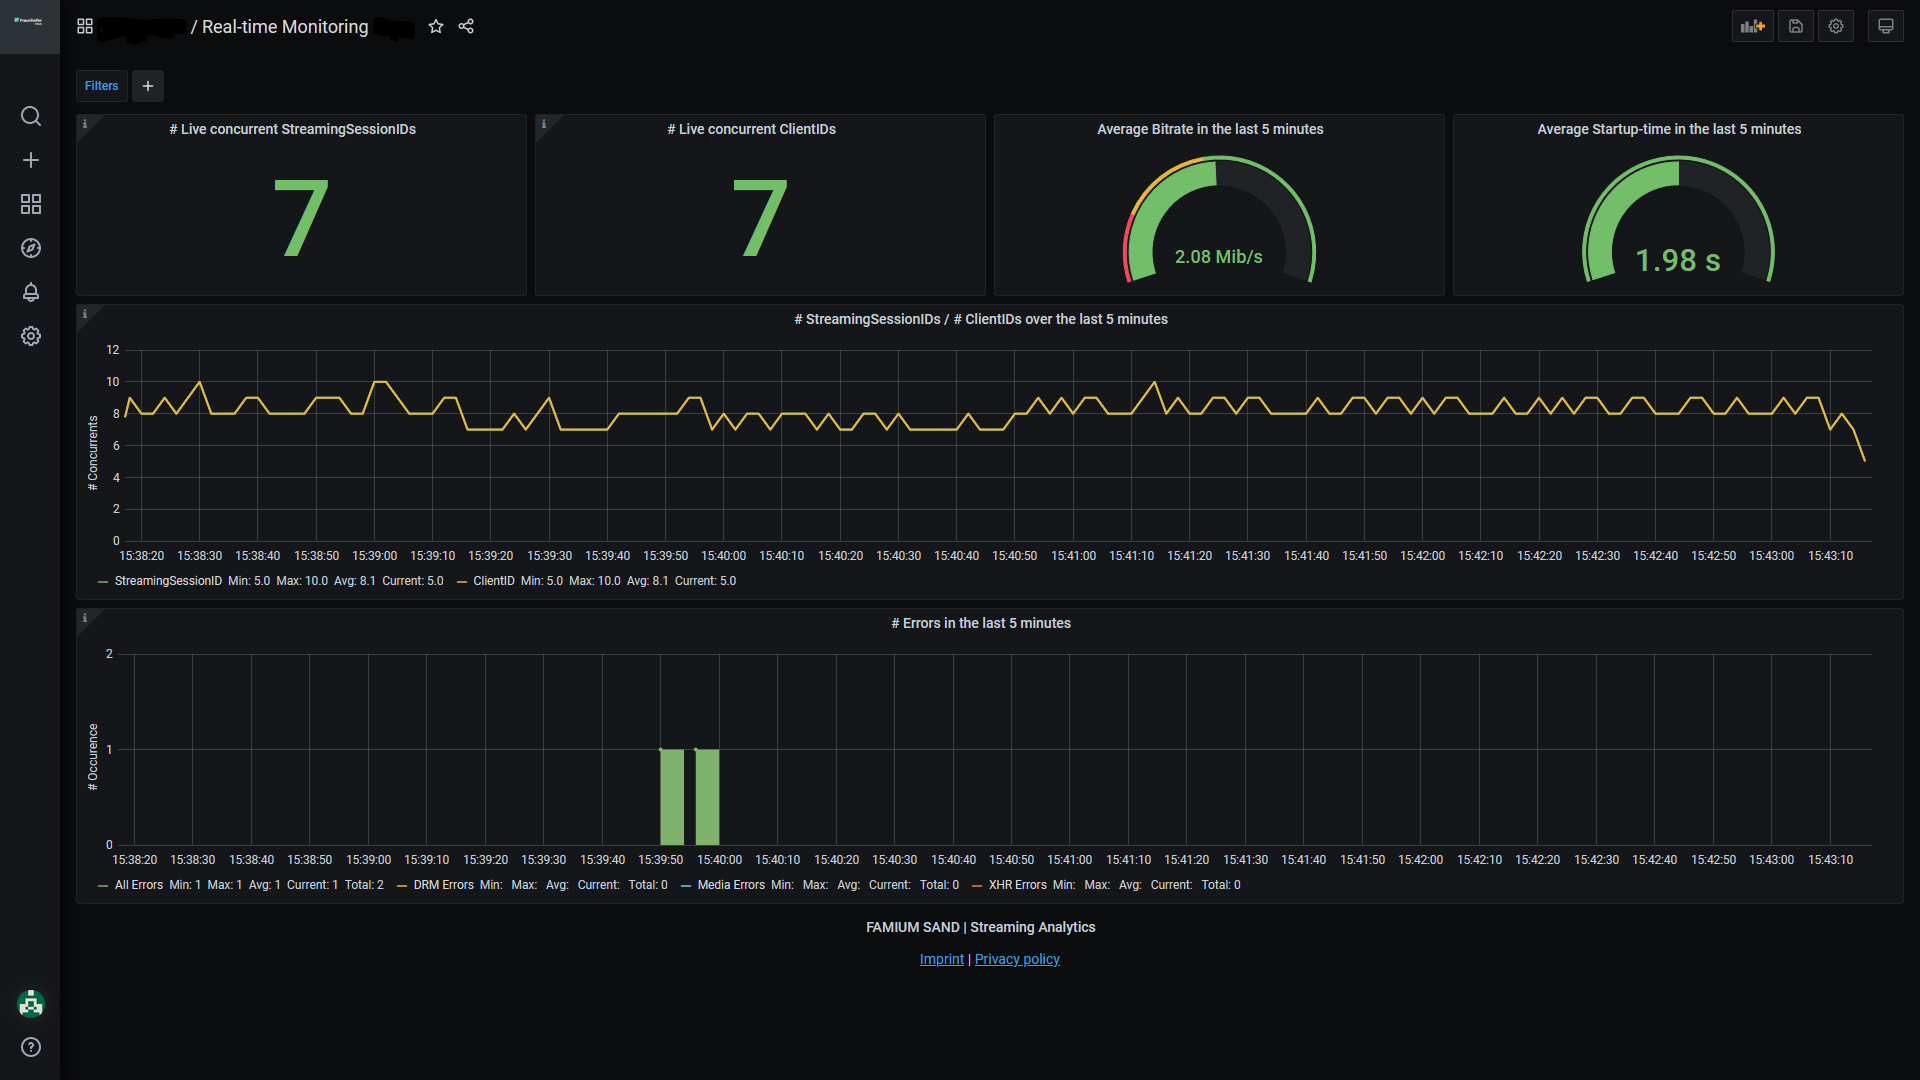
As the name implies, the Real-Time Monitoring Dashboard is for the live monitoring of streaming sessions. If you want to know what is happening right now, this is where you should look. What’s key about this dashboard is that it displays the number of concurrent streaming sessions, as well as the number of streaming sessions and errors that have happened at any given moment in the last 5 minutes.
A simple glance at the Real-Time Monitoring Dashboard already reveals if and when any serious errors occurred recently. Equipped with this knowledge, a user can then visit other dashboards to further investigate an error and the streaming session that was affected by it.
DRM Errors
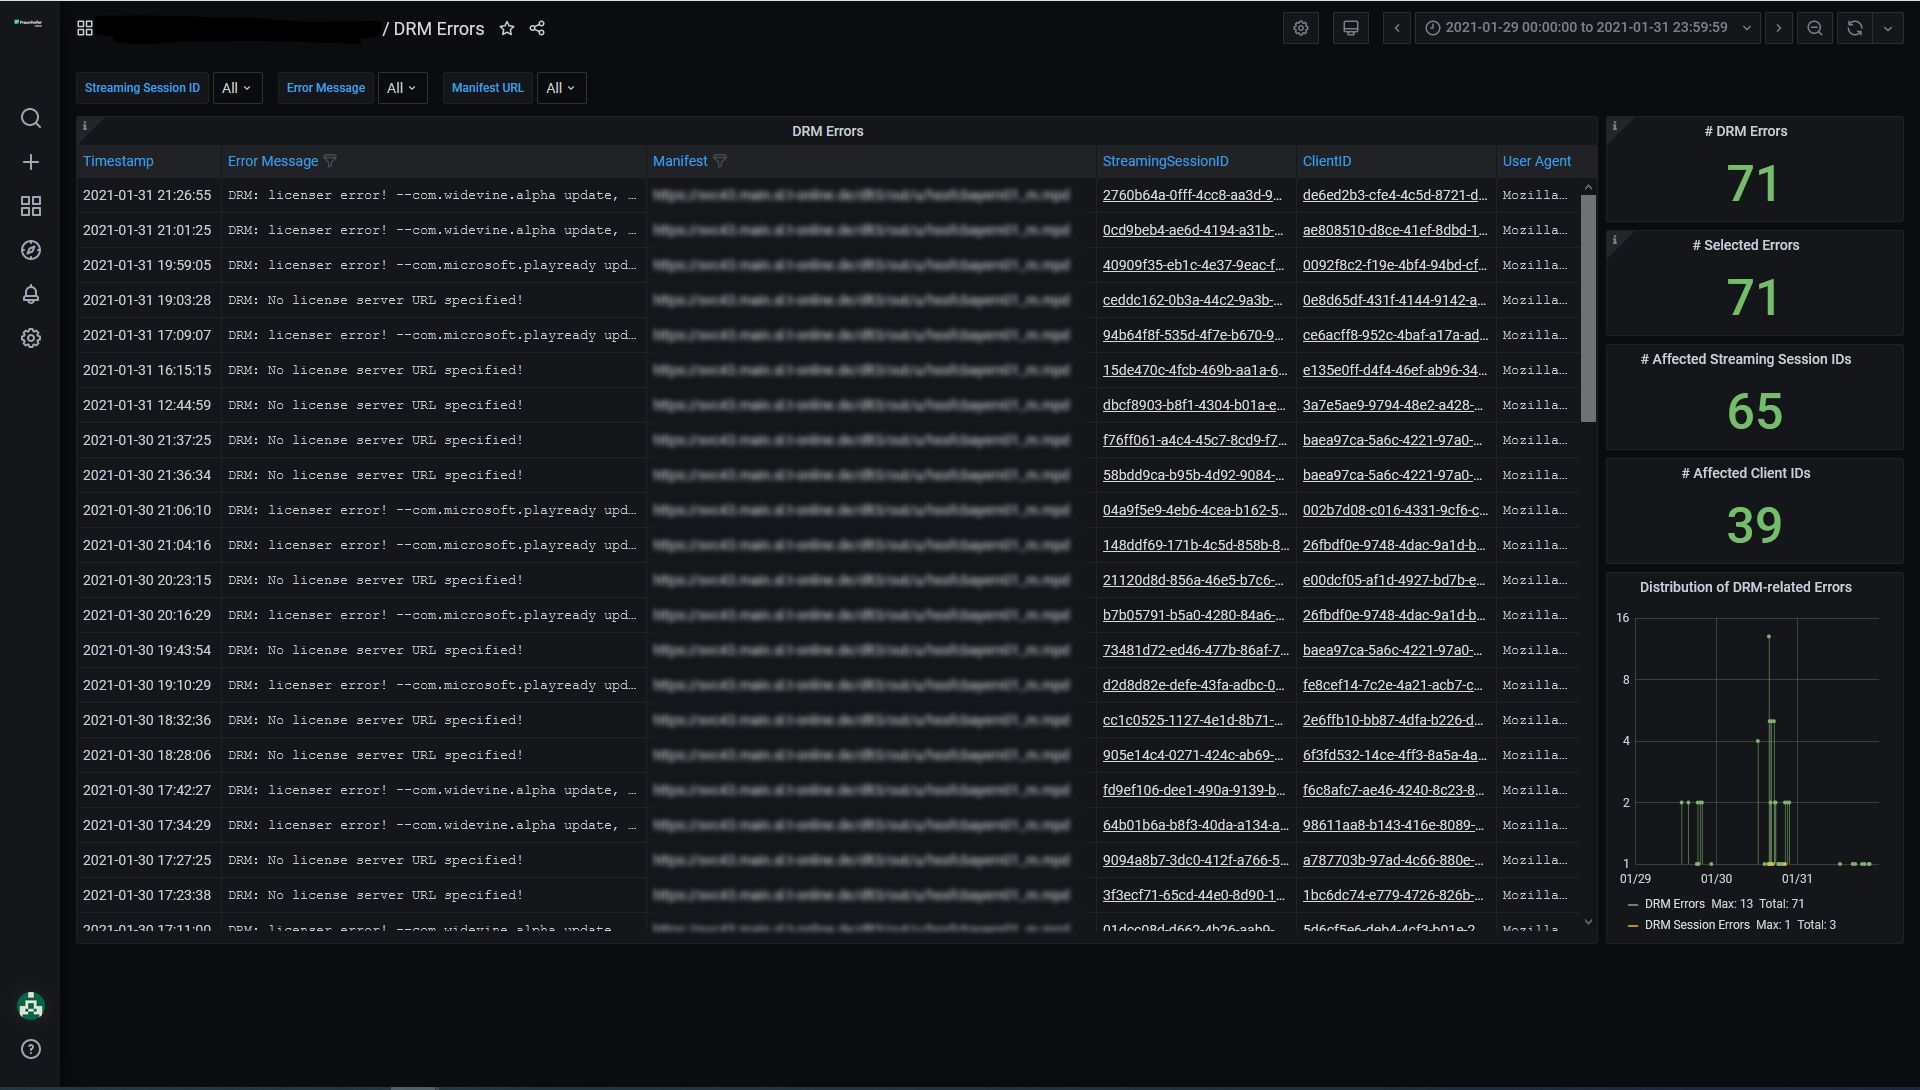
One dashboard a user might visit after identifying an important error is the DRM Errors Dashboard. This dashboard is exclusively dedicated to the most troublesome of all streaming errors, the Digital Rights Management error.
Via the time-range filter in the top right-hand corner, this dashboard has been set to display all the DRM errors from 29.01.21 – 31.01.21. As you can see, it clearly visualizes what the exact error was, when it happened and where it happened (during which streaming session, under which user agent and manifest URL). Debugging a DRM error has never been easier.
Reporting
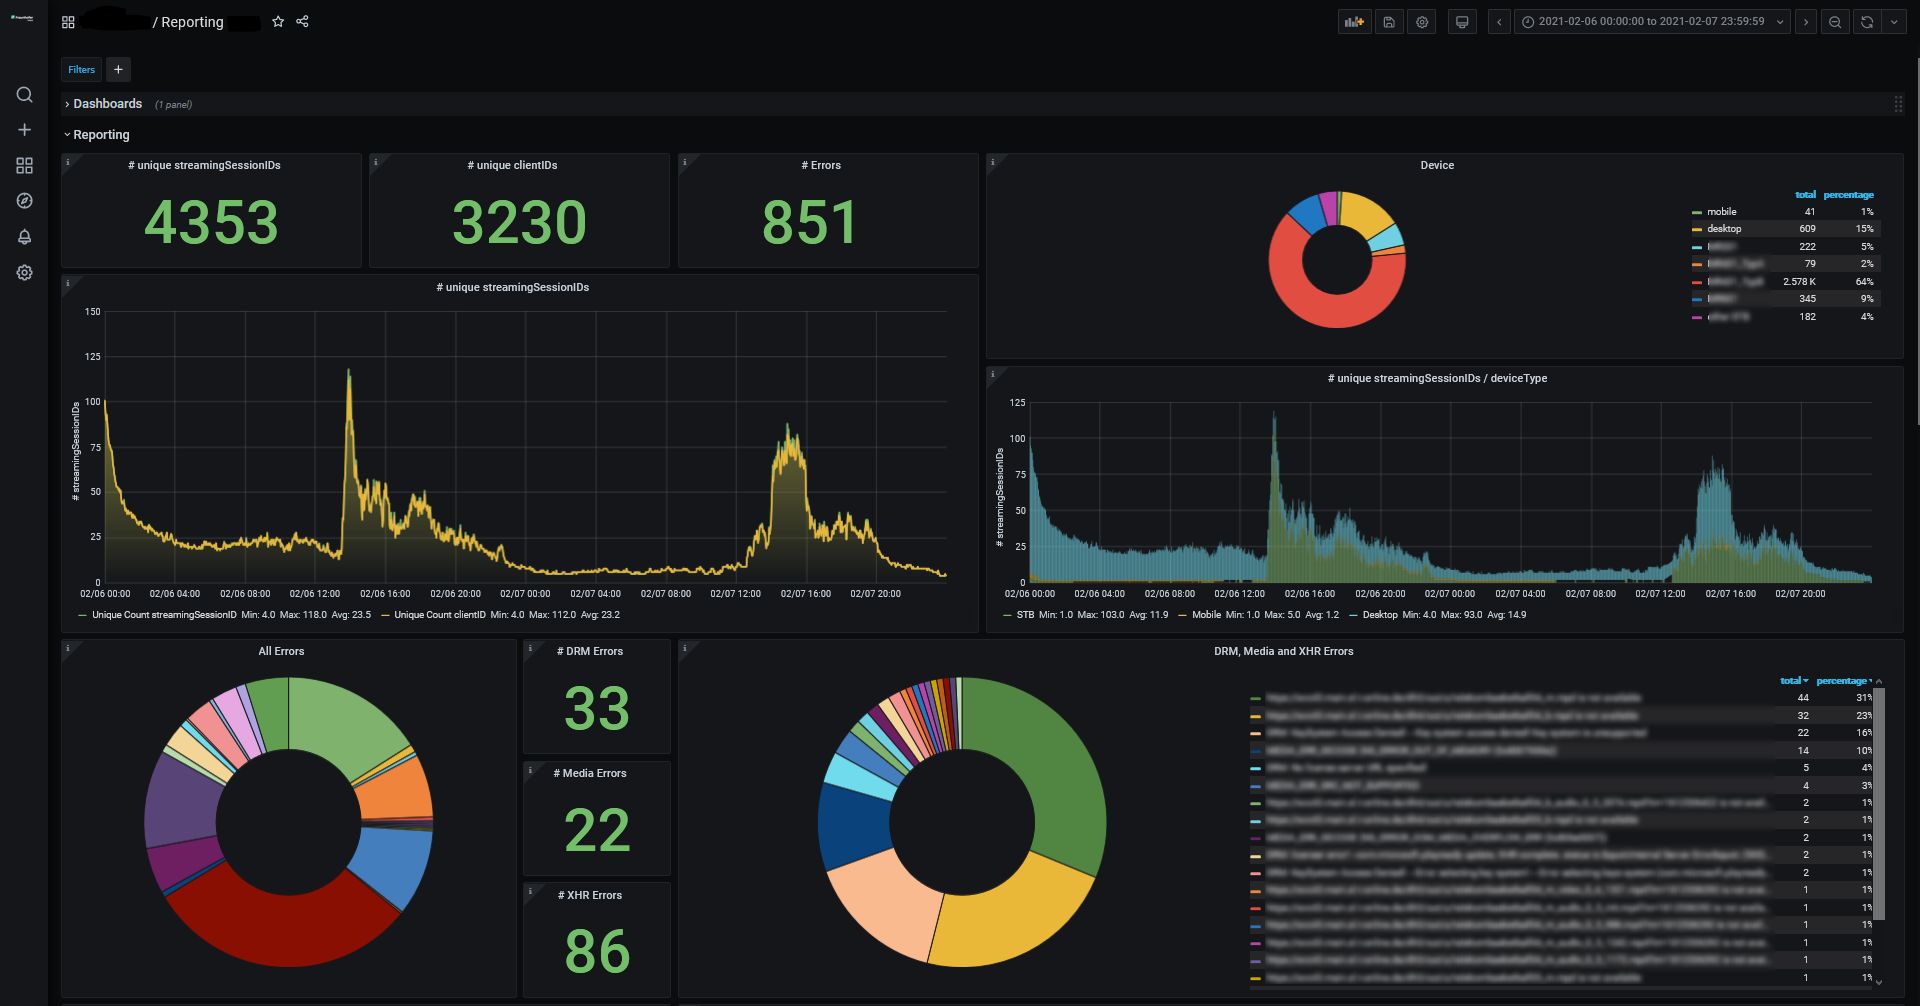
Another dashboard a user might visit after being alerted to errors is the Reporting Dashboard. It’s many graphs and tables, a portion of which are shown above, focus on big-picture insights. They answer questions like “What devices were used to stream?”, “Which were the most disruptive errors?”, and “Which sessions were affected by severe errors?”
Session Details
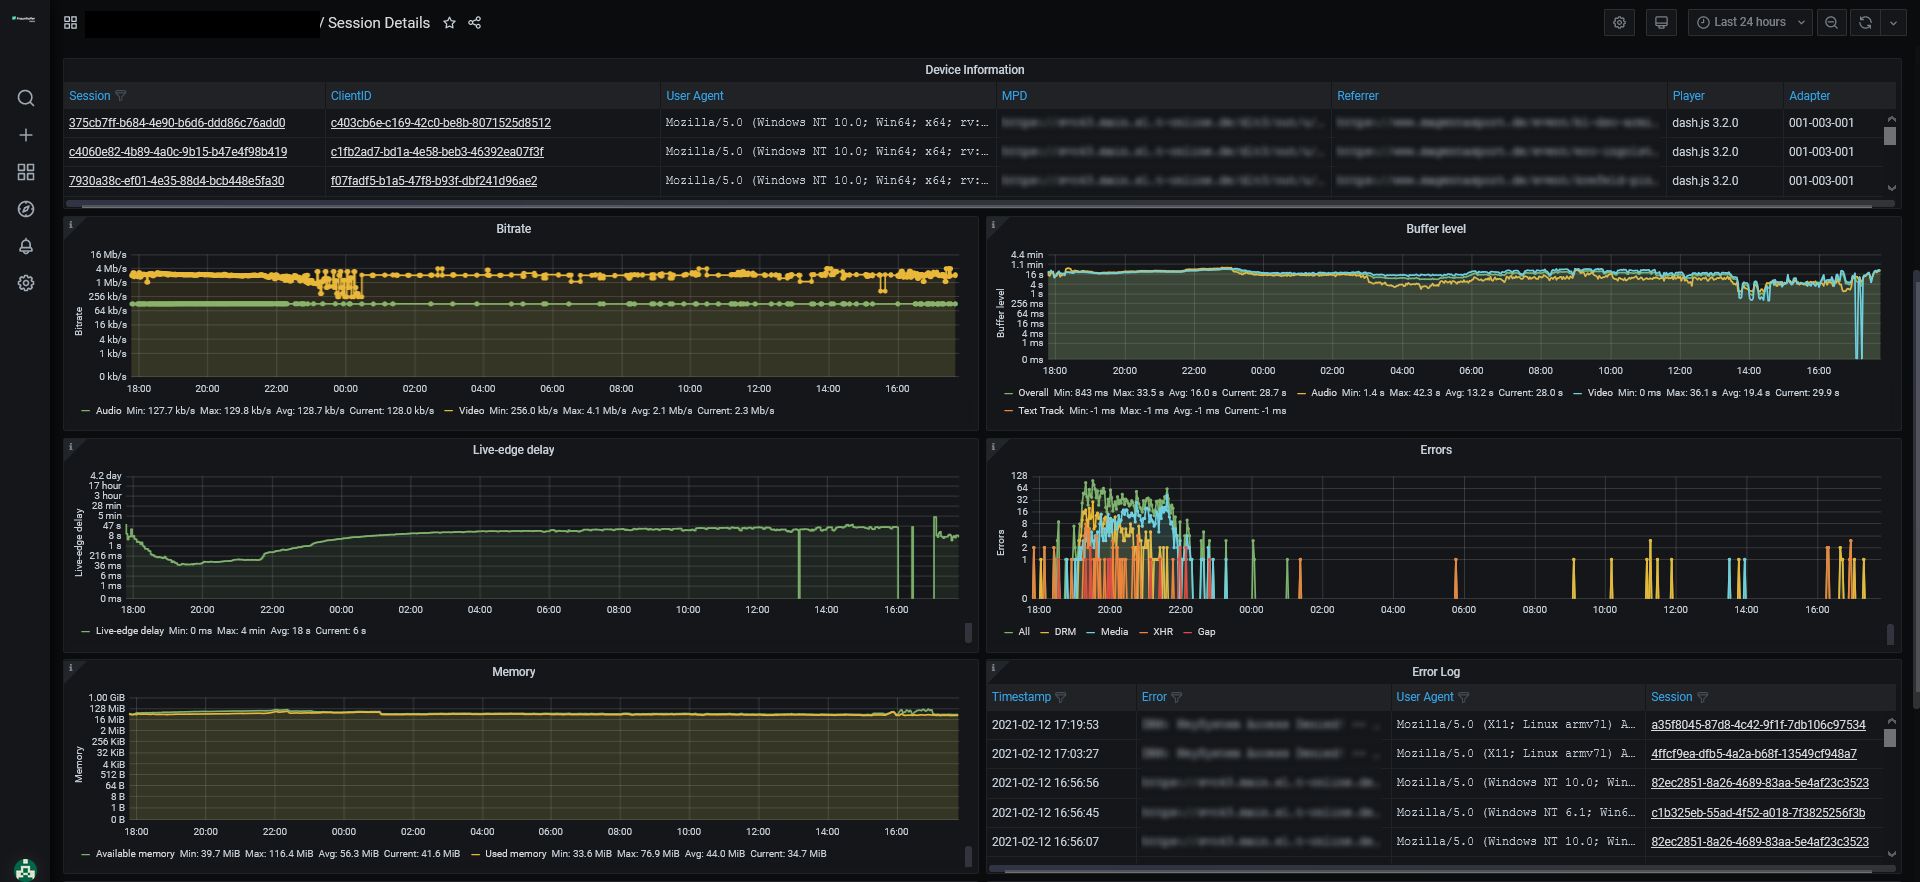
Last but not least is the Session Details Dashboard. Like the Reporting Dashboard, it is large and we have only included a snippet of it here.
As the name suggests, the Session Details Dashboard is for the in-depth exploration of a streaming session. It includes everything from a bit-rate graph to an error log. The different graphs and tables let you retrace how a streaming session unfolded, understand how different metrics are interrelated and draw conclusions about streaming quality. A user who inspects this dashboard is likely to discover the cause of an error and its effect on the streaming session.
Conclusion
There are many deep insights to be gained from collecting and processing SAND metrics. That’s why FAMIUM SAND is a leading solution in streaming analytics. Not only does it show the big-picture, it also shows the details. Its greatest strength, however, is its debugging-oriented design.
FAMIUM SAND gives its users the tools to debug the errors from streaming sessions, so they can quickly take action to solve them. For this reason, content providers who choose FAMIUM SAND are also choosing to be in the best possible position to deliver top quality service to their customers.
Next in the SAND series
SAND Dashboards: The Full Tour: Join us on a tour of all SAND dashboards and learn how effectively use this powerful tool.
For more information around SAND, check out our website.