
The Impact of Bitrate, Resolution, and Beyond
In an era where streaming has evolved into an essential and omnipresent aspect of our everyday routines, the relevance of the ecological footprint of our multimedia entertainment is gaining prominence. Behind the scenes of the seemingly effortless transmission of our favorite movies, series, TV shows, and social media, complex interconnections and a multitude of components, parameters, and variables affect the energy consumption and, ultimately, the ecological footprint of our beloved video streaming.
In this blog post series, we take a detailed look at the energy consumption of the streaming supply chain, particularly that of streaming devices like Smart TVs, to gain a deeper understanding of the factors that significantly influence energy consumption. We need to understand how much energy is consumed during streaming by individual processes to take meaningful steps to minimize these impacts and ultimately reduce the carbon footprint of streaming. Of particular interest to us is determining the share of processes and components involved in streaming that contribute to the overall energy consumption.
The streaming supply chain ranging from content creation to display video on user screens is complex, with effects like scaling, concurrent viewers or distribution playing a crucial role and significantly influencing overall considerations. To understand these interconnections and their effects, it is essential to measure energy consumption along the supply chain. We differentiate between various usage scenarios such as live streaming and video-on-demand, particularly measuring the energy consumption of individual components and analyze them in the context of the overall energy demand of the end-to-end streaming supply chain. So, what are the key factors that significantly influence energy consumption when streaming on Smart TVs and streaming devices? Does the widely cited relationship between bitrate and energy consumption in video streaming exist? How relevant is it for the end-to-end consideration of the ecological footprint of the streaming supply chain? Do other factors such as resolution, High Dynamic Range (HDR), the video and audio codec used, the network interface, or e.g. the TV’s display technology (OLED, QLED, LED) play a role? Or is the content itself the decisive factor in determining energy consumption? Let’s explore…
Green Streaming Measurement Architecture – Integrating Energy Consumption Data and Streaming Metrics through the FOKUS FAMIUM Stream Analytics and ABR-Testbed solution
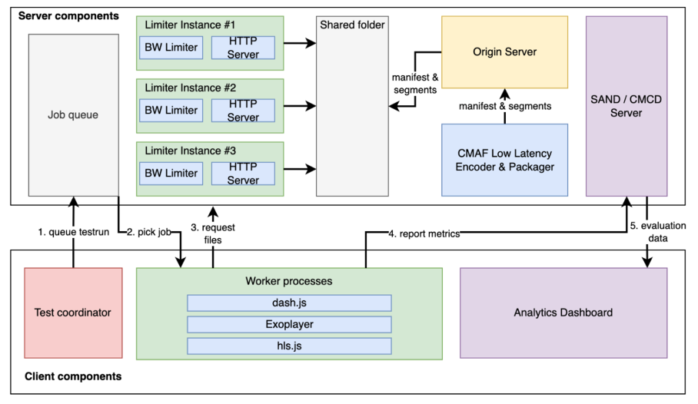
Our goal is to combine precise energy measurements, i.e., real-time power consumption data from streaming devices, with player and session metrics. Using our FOKUS FAMIUM Stream Analytics Solution, we create the opportunity to combine energy consumption data and streaming metrics in one tool and generate analyses based on it. To validate the measurements and substantiate the results, measurements are repeated in a clearly defined test procedure. For this purpose, we have developed a measurement framework that, using our FAMIUM Adaptive Bitrate Testbed (ABR Testbed), enables the automation of measurements on streaming devices and transfers them, along with simultaneously recorded session metrics, into a common and reliable database through FAMIUM Stream Analytics. To evaluate the data, FAMIUM Stream Analytics provides individual dashboards. In another step, the measurement results are processed and used as a data basis for modeling a digital twin of the streaming chain and for training AI models to optimize its energy efficiency.
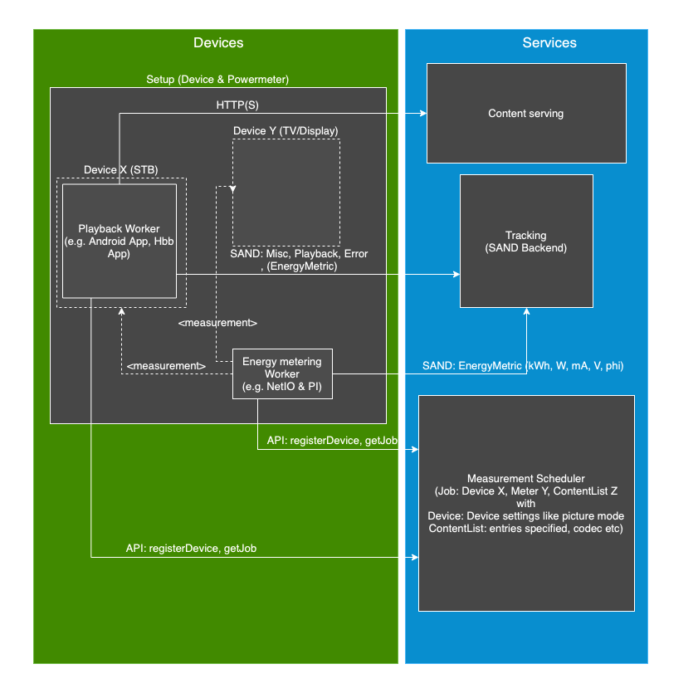
To describe the measurement and test environment, we have defined an attribute triplet that includes but is not limited to the following parameters:
Content Attributes: complexity, luma, color histograms, codec, frame rate, GOP size, encryption, container, and packaging.
Device Attributes: display technology, brightness level, stationary/mobile, light conditions, player type, and ABR algorithm.
Network Attributes: connection type, bandwidth, jitter, and packet loss.
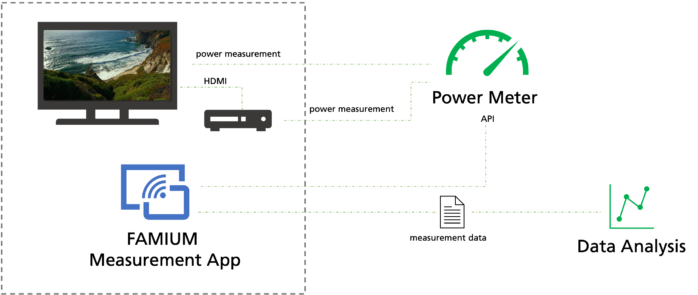
While the reference architecture is still in development, we have implemented a simplified measurement setup as depicted in illustration “ExoPlayer-based Measurement”. This setup consists of a 4-way Power Meter (NETIO PowerPDU 4PS) and an Android TV measurement application based on ExoPlayer. Our measurement app plays the custom-created reference content on the respective end device (Smart TV or streaming box), simultaneously reads the energy measurement data via the JSON API from the power meter and writes a measurement data log on a per second basis. This log includes not only energy consumption values but also player metrics such as player state, playback position, media URLs, etc., which are captured and made available for analysis. With the power meter, up to four devices can be measured simultaneously. We leverage this capability by, for example, examining the energy consumption for streaming test content directly through the app on the Smart TV and comparing the results with the case where the TV is fed via HDMI from a streaming box or stick. The difference between the two measurements can be considered, within certain limits, as the portion required on the TV for network communication and decoding of the stream.
Reference Content
To run measurements on end devices, we initiate tests with some basic content and stream parameters to determine if these parameters have a measurable impact on energy consumption. Artificially generated video streams were used for this purpose, aiming to cover a wide range of decoding complexity from very simple to very complex. Through these streams, we aim to investigate the extent to which different stream complexities influence the energy consumption of the end device. The most challenging stream to decode consists of individual frames with random pixels (‘random pixel’), devoid of any repeating patterns. This complexity hinders efficient compression within frames and provides no consistency between frames, thereby impairing efficient inter-frame and intra-frame compression.

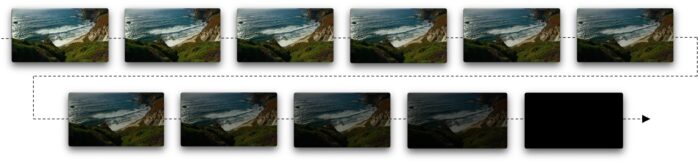
The source materials for each video consisted of frames showing a monochromatic gray color with varying brightness. The brightness started at zero and then increased in steps of 16 up to 240. The first frame (black) and the last frame (white) are each repeated for three minutes, while each frame in between is displayed for one minute. This creates a brightness timeline over 20 minutes of video runtime.
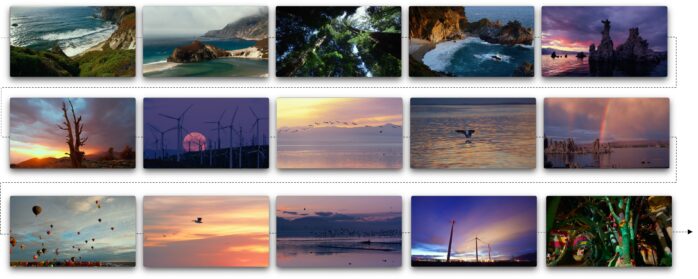
Another video (‘timescapes’) uses realistic content featuring various natural scenes, repeating every 30 seconds. The content starts in its original form at 100% luminance, and with each repetition, the depicted content darkens by 10%.

Furthermore, various combinations of content attributes such as resolution, bitrate, codec, frame rate, and SDR/HDR were generated and used for measurements. By this, we aim to examine the impact of different stream properties on energy consumption. As mentioned earlier, this investigation is intended for all relevant components of the streaming chain, and currently, our focus is on end devices, particularly Smart TVs used in streaming.
Measurements were conducted using the ExoPlayer-based measurement application playing the generated test content. We will discuss and explain selected results in upcoming posts of this series “Decoding Green Streaming: The Impact of Bitrate, Resolution, and Beyond”.
Part 2 will feature evaluation of measurements and results, unveiling exciting insights on the impact of content characteristics, stream parameters, and display settings to overall energy consumption when streaming. Stay tuned…
Curious about our activities in green streaming? Explore green-streaming.de for details and reach out to us!
contributing authors: Robert Seeliger, Minh Nguyen, Martin Lasak, Görkem Güclü, Daniel Silhavy