
In the second blog post of the SAND series, we will take a detailed look at the different FAMIUM SAND dashboards: Real-Time Monitoring, Reporting, Errors Overview, DRM/ Media/ XHR Errors and Session Details. Read on to discover what the purpose of each dashboard is and how best to use it.
Real-Time Monitoring Dashboard
The Real-Time Monitoring Dashboard is for the live tracking of the “health” or performance of the streaming service. It focuses on what is happening right now, so the data displayed is 5-minutes-old or younger.
Made to “paint a picture” at a glance, the dashboard contains only a handful of panels with the key information you need in order to know if a streaming service is performing well or not:
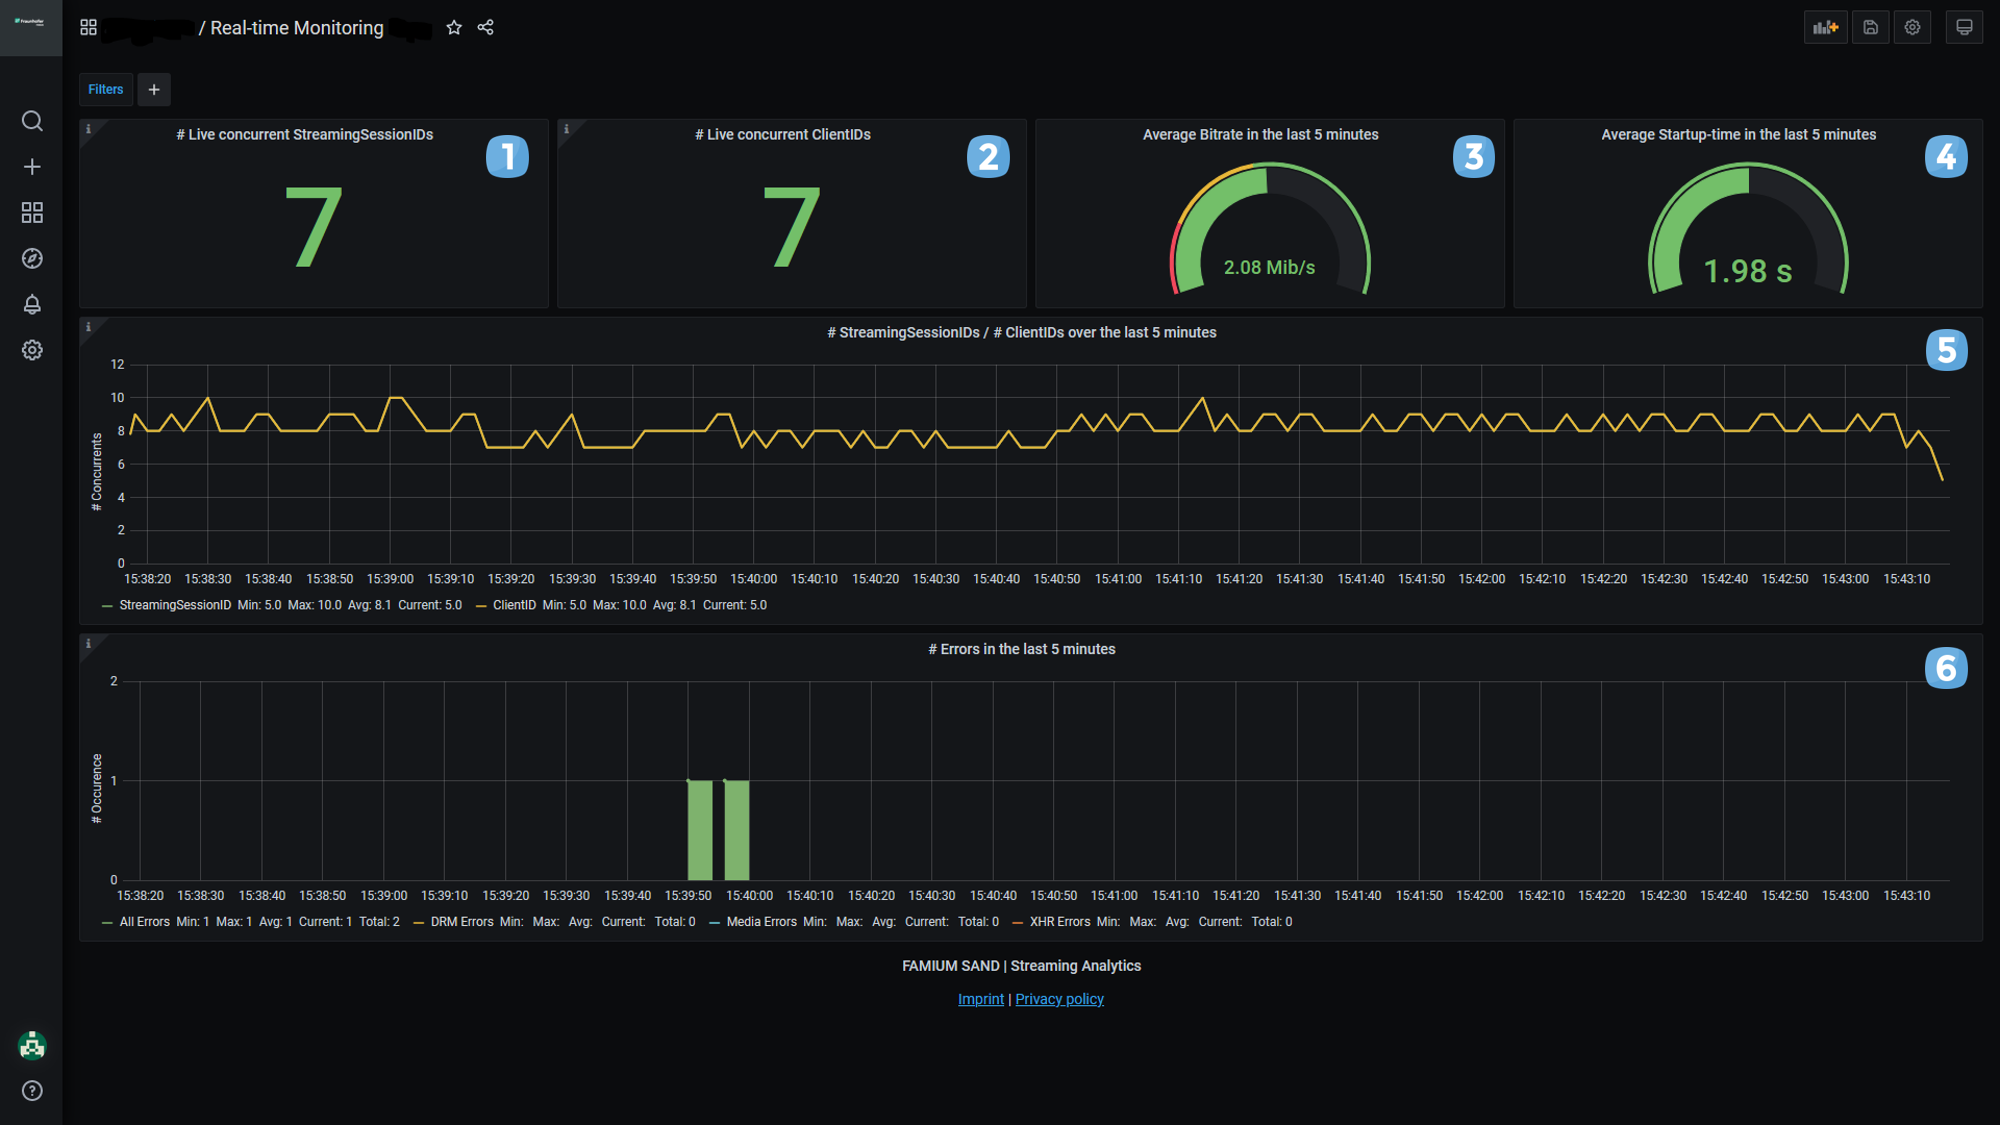
- The number of streams being watched right now
- The number of clients[1] watching streams right now
- The average bit-rate of the streams over the last 5 minutes
- The average start-up time of the streams over the last 5 minutes
- The number of streams and clients that were active in the last 5 minutes
- The number and types of errors that occurred in the last 5 minutes
Tip: Use this dashboard to discover the number of concurrent streaming sessions, what errors occurred, if any, and asses the general health of streams (ideally, you want to see high bit-rates, low start-up times and few to no errors).
Reporting Dashboard
The Reporting Dashboard is for big-picture insights. Its panels give a comprehensive summary of streaming service usage and performance for the defined time-interval:
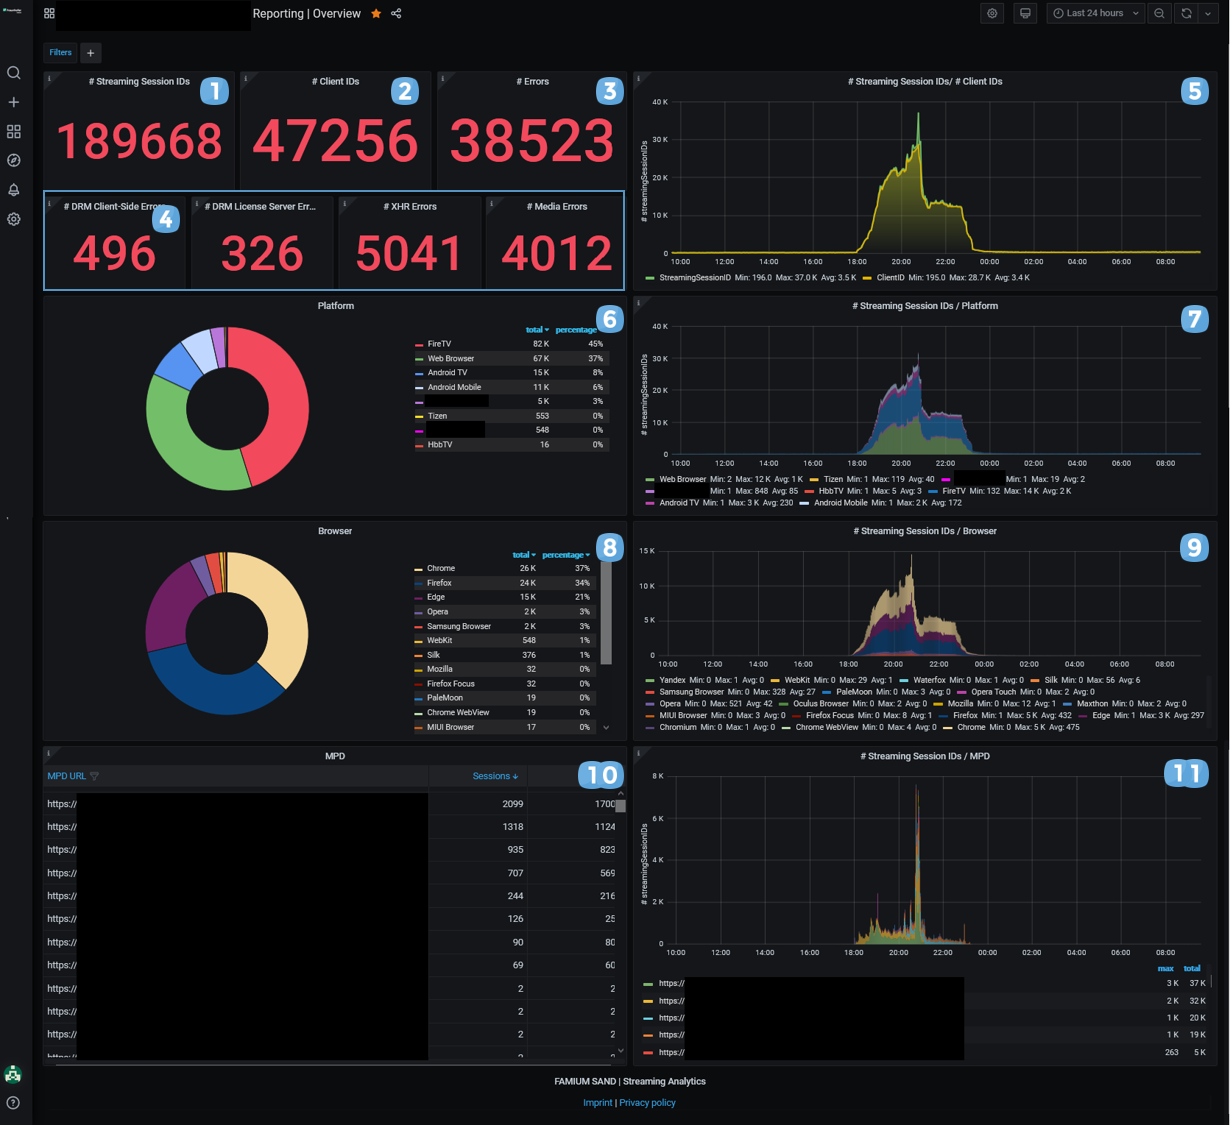
- The total number of streams watched
- The total number of clients who were active
- The total number of errors
- The total number of DRM, Media and XHR errors
- The average number of streaming sessions and clients over time
- A breakdown of the platforms used to stream
- The average number of active platforms over time
- A breakdown of the browsers used to stream
- The average number of active browsers over time
- A list of the different manifest URLs used to stream
- The average number of active manifest URLs over time
Dashboard panels are interactive, meaning that they contain even more information than initially visible. The interactivity gives you control to explore the data. Elements can be hovered over, clicked on, zoomed into and much more.
The best way to learn all the interactive features is by exploring them yourself. When using the dashboard, don’t be afraid to click and drag your mouse around!
Tip: Use the Reporting Dashboard to get a broad understanding of your audience. Answer questions like “How many people were streaming and when?”, “What devices were used to stream?” and “Which are the most popular manifest URLs?”. Once you are equipped with big-picture insights, investigate specific sessions or errors in more detail using other dashboards.
Errors Overview Dashboard
FAMIUM SAND focuses on being a debugging/error analysis tool. As a result, this dashboard offers an overview of all errors that happened within a given time-range. It is divided into five sections: General, DRM License Server Errors, DRM Client-Side Errors, XHR Errors and Media Errors.

- The general section shows all errors that occurred. In more targeted panels, it also homes in on the serious errors (DRM, XHR and Media) that were thrown. In this section, you will find:
- The total number of errors that occurred
- A pie chart of all errors
- The number of errors thrown over time
- A pie chart showing a breakdown of serious errors (DRM, XHR and Media) only
- A pie chart showing the number of streaming sessions affected by serious errors (DRM, XHR and Media)
- A list of streaming sessions affected by DRM, XHR and Media errors
Tip: If you see a streaming session ID or client ID in the table (6) that you want to take closer look at, click on the ID. You will automatically open the Session Details page of that session/ client in a new tab.
- The DRM License Server Errors section drills into, as the name suggests, all DRM license server errors. Included in this section are:
- The total number of DRM license server errors
- A breakdown of the different types of DRM license server errors
- The number sessions affected by DRM license server errors over time
- A breakdown of the devices affected by DRM license server errors
- A breakdown of the browsers affected by DRM license server errors
- A list of the specific DRM license server errors together with the specific platform and browsers that were impacted
- The other sections (DRM Client-Side Errors, XHR Errors and Media Errors) are built identically to the DRM License Server section described above, but for inspecting DRM client-side, XHR and media errors respectively.
To summarize, the Errors Overview Dashboard tells you what went wrong, where and when. It informs you about key stats (e.g. the total number of errors), key groups (e.g. the different types of XHR errors that were thrown), and observable trends (e.g. whether specific errors are reoccurring on specific platforms).
Tip: Use this dashboard as a starting point to gain a clear picture of the error-landscape. Check key stats and identify trends or patterns. After that, start debugging specific errors using either the DRM/ Media/ XHR Errors Dashboard or the Session Details Dashboard.
DRM/ Media/ XHR/ All Errors Dashboard
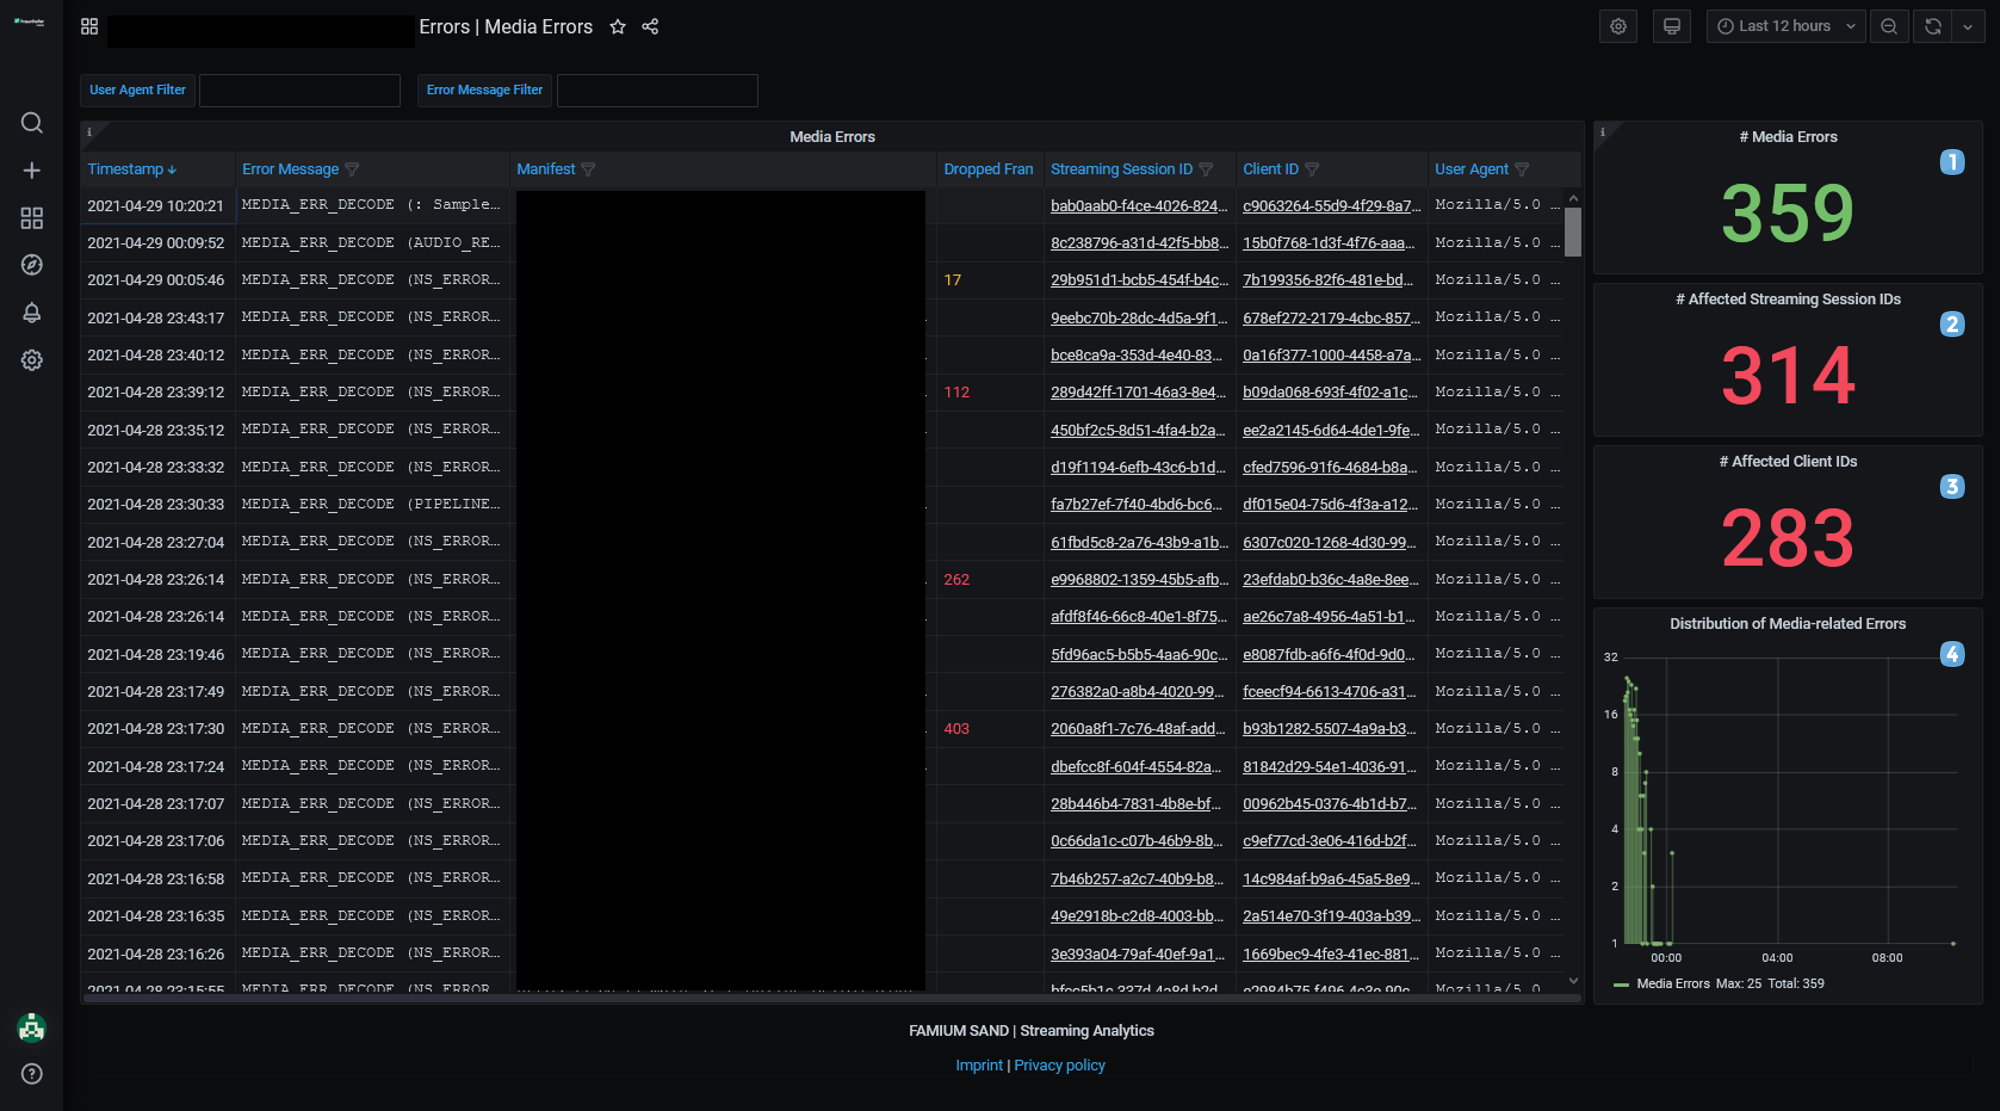
FAMIUM SAND provides five tabular dashboards for exploring DRM, Media, and XHR errors in details (the DRM License Server Errors Dashboard, DRM Client-Side Errors Dashboard, Media Errors Dashboard, XHR Errors Dashboard, and All Errors Dashboard). These five dashboards are structured identically, so in this post we will only introduce one of them: the Media Errors Dashboard.
Tip: Use these tabular dashboards to investigate errors in detail. The table helps you debug, because for each error it lists the full error message, when it happened, where it happened (which streaming session, which client and what user agent), and what manifest URL the error is linked to. In the case of media errors, the table also shows how many frames were dropped during streaming.
The Media Errors Dashboard shows all media errors from the last 24 hours. If you like, you can toggle the time-window on the top right-hand corner of the dashboard to set a different time-range.
Text boxes above the table let you filter for error messages and user agents. This makes inspection easier by, for example, quickly letting you find out which sessions were affected by media errors containing the word “pipeline”. Column filters in the table itself also let you filter for error messages and user agents, and additionally let you filter for streaming session IDs, client IDs and manifest URLs.
The panels on the right will ensure you never lose sight of the big-picture, even when you are looking at the details of a media error. They show:
- The total number of Media Errors that happened in the time-range (12h)
- The total number of streaming sessions affected by media errors
- The total number of clients affected by media errors
- The time series distribution of all media errors
Session Details
Visiting the Session Details Dashboard is like taking a lens to a streaming session. It displays all the metrics collected from a streaming session and puts the dashboard user in control of exploring the data.
The easiest way to arrive at this dashboard is to click on a streaming session ID link in another dashboard, for example in the Session Overview Dashboard, which is like a staging area to the Session Details Dashboard. The table helps the user identify streaming sessions worth exploring in more depth by listing key metrics like startup time or number of errors. Once you’ve found a streaming session you want to dive into, simply click the link! Navigating into Session Details this way will ensure that the time-window encompasses the entire duration of the session.
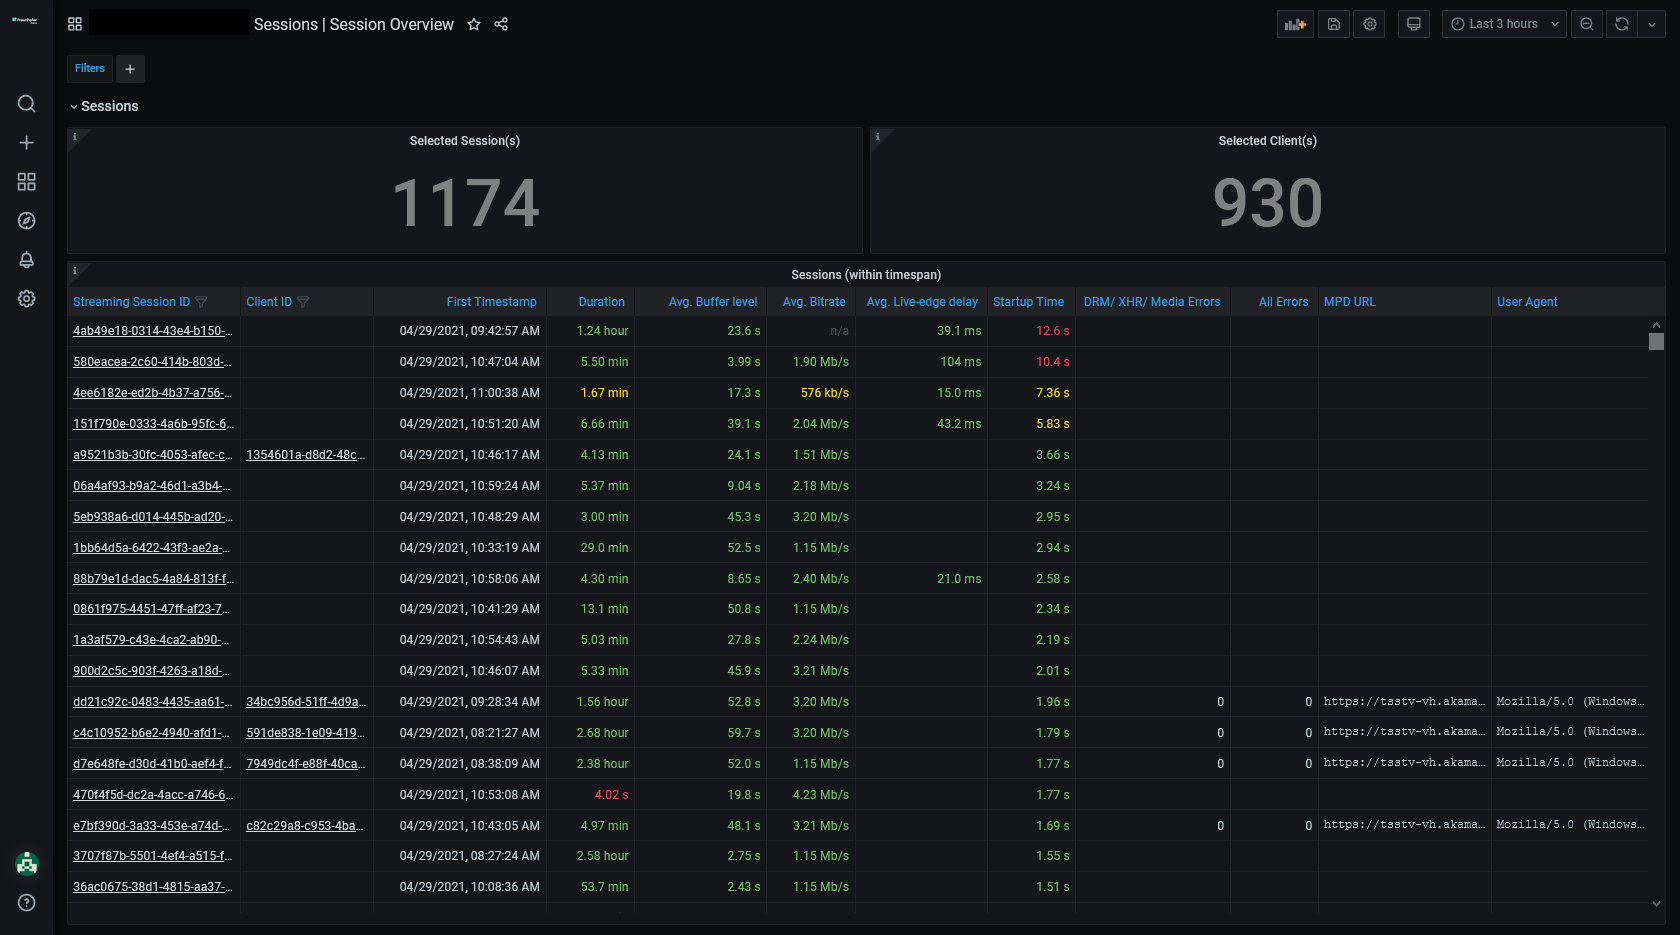
Once in the Session Details Dashboard, make the most of the fine-grained metrics at your fingertips by (interactively!) exploring the panels. These include:
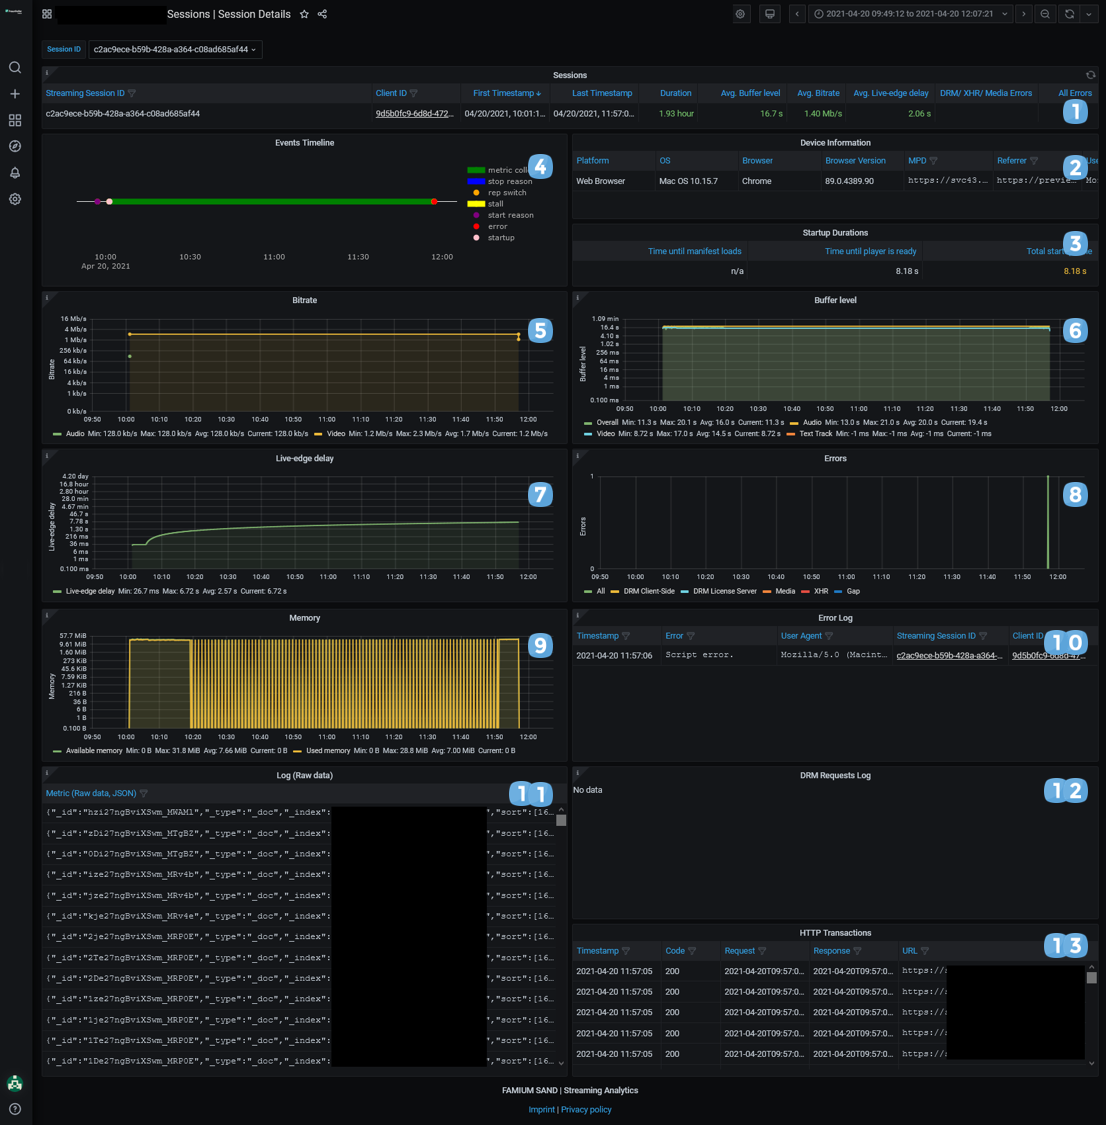
- A table with key data about the streaming session (streaming session ID, client ID, first and last timestamps, session duration, average buffer level, average bit-rate, average live-edge delay, and number of errors)
- A table listing device information (platform, OS, browser, browser version, manifest URL, user agent, referrer, player, and adapter)
- A table specifying startup durations (manifest loading time, player loading time, and total startup time)
- A timeline pin-pointing the events that happened during the stream
- The average bit-rate of the session over time
- The average buffer level of the session over time
- The average live-edge delay of the session over time
- The errors that occurred during streaming
- The average memory usage of the session over time
- A list of all errors that occurred (Error Log)
- All the raw data reported by the client
- All DRM requests sent by the client
- All HTTP transactions made between client and server
Tip: Use this dashboard when you want to understand a streaming session in depth. Observe how a streaming session unfolded, identify relationships between different metrics and draw conclusions about the causes and consequences of an error.
Conclusion
At FAME, we build dashboards with our customers’ informational needs and user-experience in mind. Our aim is to deliver an indispensable tool for every content provider’s toolbox.
After reading this blog post, you should be familiar with the different FAMIUM SAND dashboards and their capabilities. You should also feel confident to use them to debug errors and investigate the performance of your streaming service. If you have any suggestions for new features, let us know in the comments. We look forward to hearing your ideas!
[1] Each stream or streaming session receives a unique ID. A client is the anonymized person who has watched the stream. Over the course of their streaming life, a client will watch many streams; some streams might even be watched simultaneously in different browser windows.