

In part 1 of this blog post series, we set the stage for our analysis on energy efficiency and energy saving potentials in streaming by introducing our Green Streaming Measurement Architecture that seamlessly integrates Energy Consumption Data and Streaming Metrics via the FOKUS FAMIUM Stream Analytics and ABR-Testbed solution. Additionally, we provided a summary of our test content used for the conducted measurements.
Let’s get started with part 2! We will evaluate measurements and results, revealing valuable insights into how content characteristics, stream parameters, and display settings impact overall energy consumption of streaming devices.
Bitrate, Resolution, Framerate and Brightness of Content and its Impact on the Energy Consumption of Streaming Devices
Setup and Methodology
In an initial series of measurements, we had various streaming devices play exactly the same content while measuring their power consumption and energy usage. We selected Smart TVs with different display technologies from the categories OLED, QLED, Full Led, and Edge LED, with the aim of examining the energy signatures of these various technologies for our test content. Additionally, an Android-based streaming box was used, serving as a player for the TVs via HDMI and measured separately from each TV. This approach aims to reduce the TVs to their basic function as a display, thus excluding the possible influence of additional processing steps for content reception and decoding from the analysis. Simultaneously, the measurements from the streaming box, which is primarily responsible for content reception and decoding without a display, provide a benchmark for the energy consumption of these processes. They would not be separately measurable on the Smart TV, which additionally handles the display presentation.
Energy Signatures of different display types
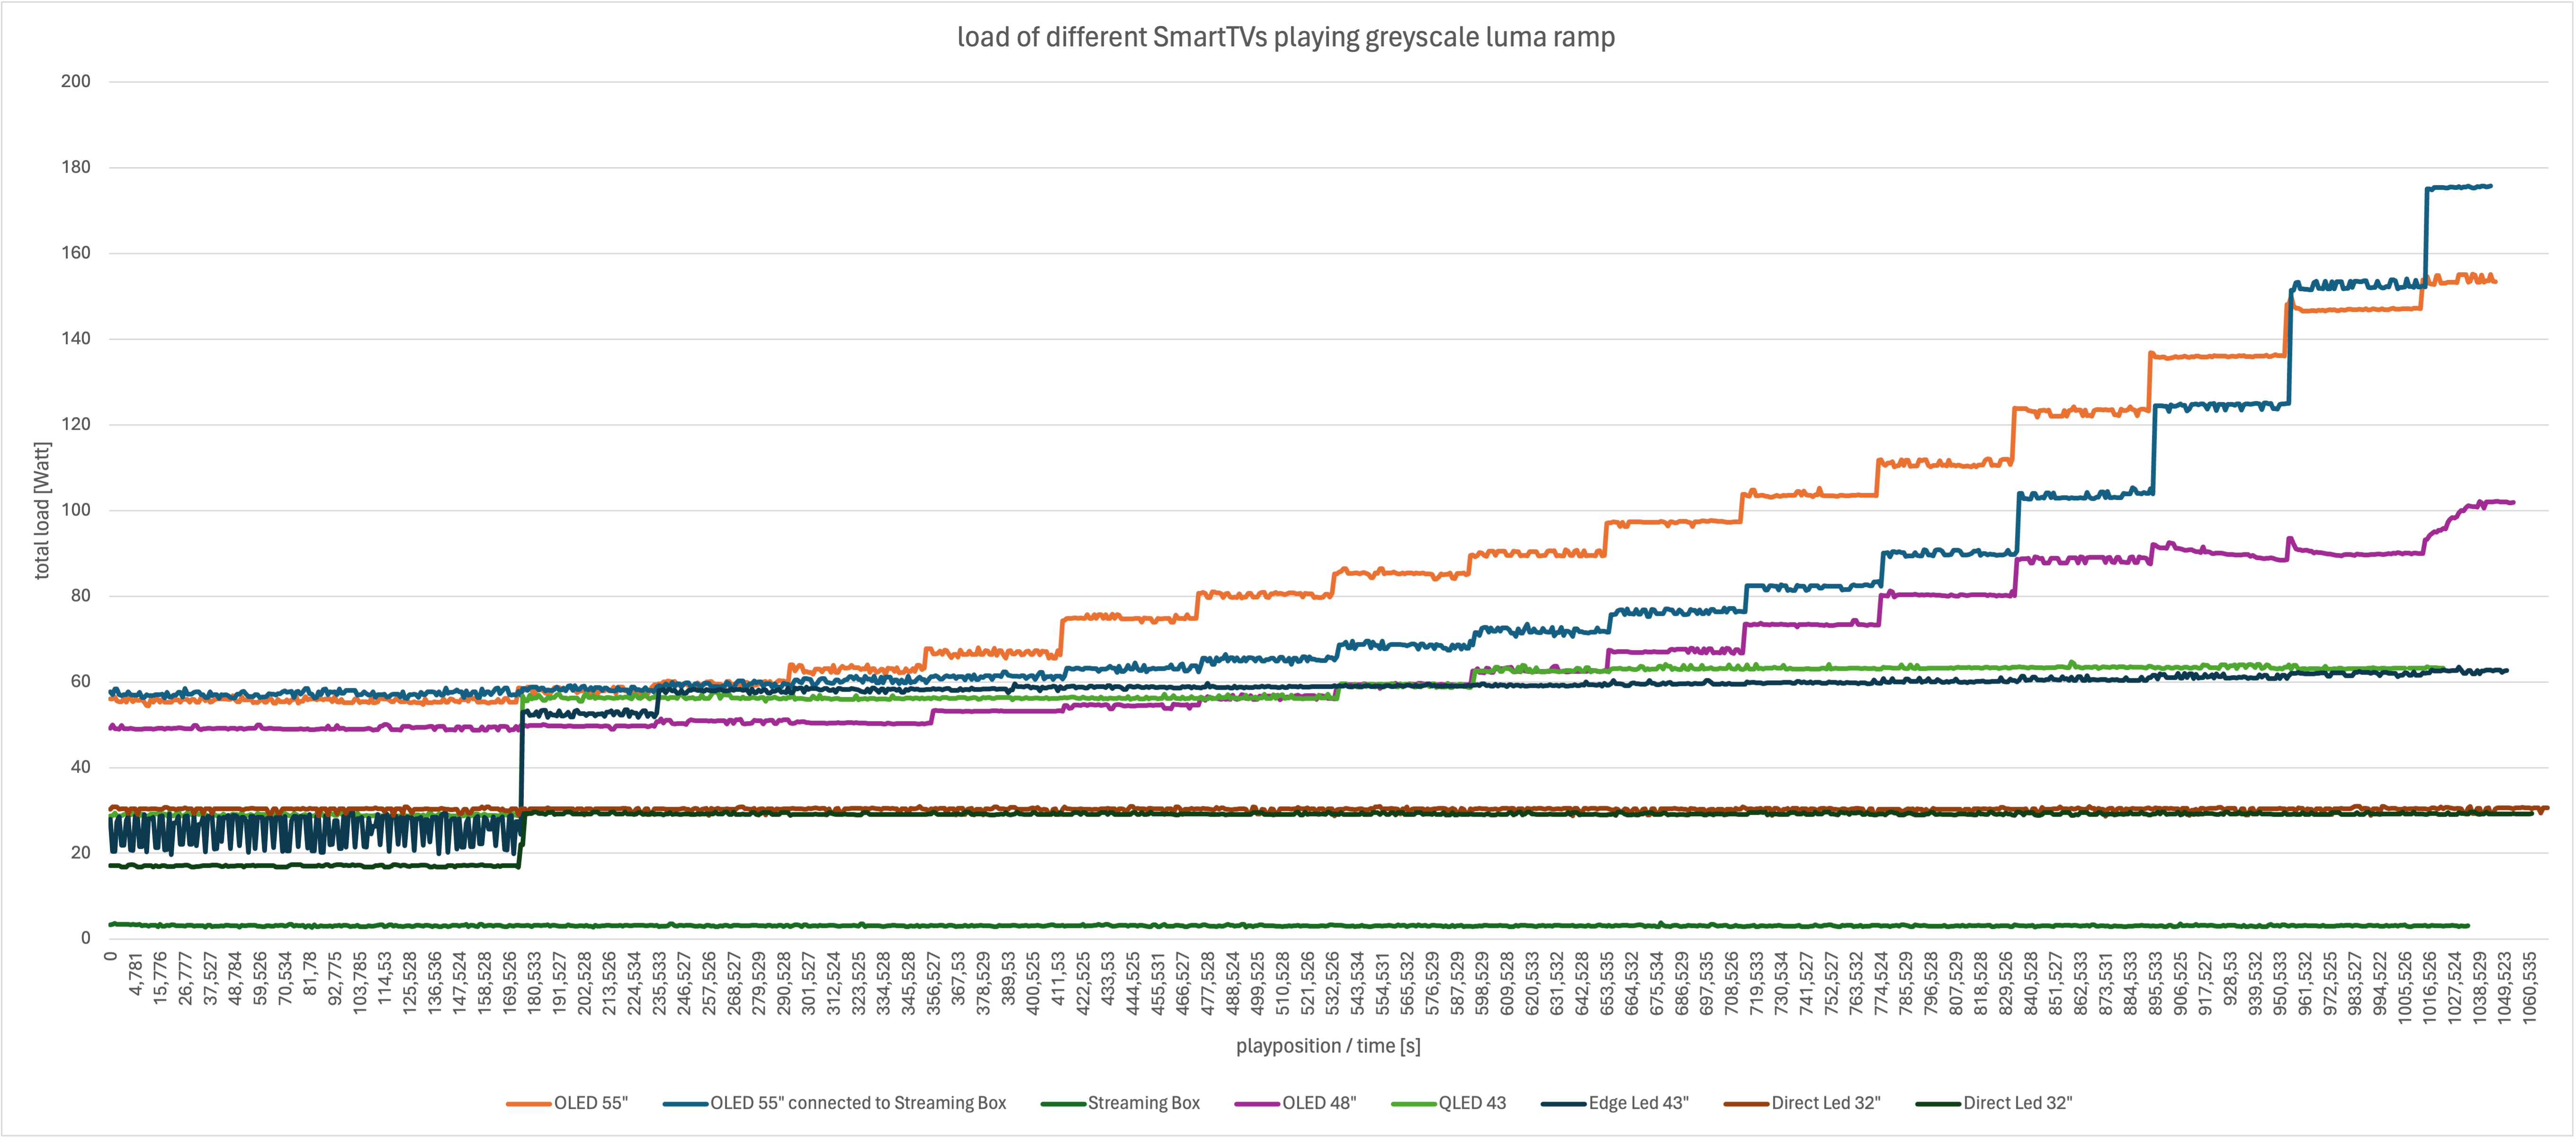
In comparison, different energy signatures are evident, primarily determined by the display technology. OLED TVs showed a direct and traceable correlation between energy consumption and the brightness of the content to be displayed, as OLED displays can control and illuminate individual pixels directly. In our measurements, this characteristic is observed in the gradual increase in power consumption of OLED TVs with incremental brightness of the content. The QLED TV used in the test also shows a recognizable stepped curve; however, the differences in power consumption per step are significantly lower, and beyond a brightness of approximately 50%, the required power of the TV is almost constant. Only in the range of full black a significantly lower power consumption has been recorded. The pattern is even more pronounced with TVs featuring traditional LED displays. Both Edge LED devices and TVs with a Direct LED panel exhibit an almost constant power consumption as soon as the content to be displayed transitions from complete black to content with a certain brightness. This behavior can also be explained by the employed display technologies. On Edge LED, the screen’s backlighting is achieved through laterally arranged LEDs, with their light distributed across the entire panel through mirrors. Therefore, when a portion of the screen is intended to display content with brightness values different from black, the Edge LED illumination must be activated. Energy-efficient adaptive switching or even local dimming is not possible in this case. With Direct LED screens, the LEDs are arranged evenly across the entire screen and can be controlled and dimmed locally, depending on the device and configuration. However, a significant effect on the TV’s power consumption based on the brightness of the displayed content is hardly detectable on the tested devices. The energy signature shows an almost constant curve. To validate these results, we plan comprehensive tests using the automated measurement system currently under development and already explained earlier.
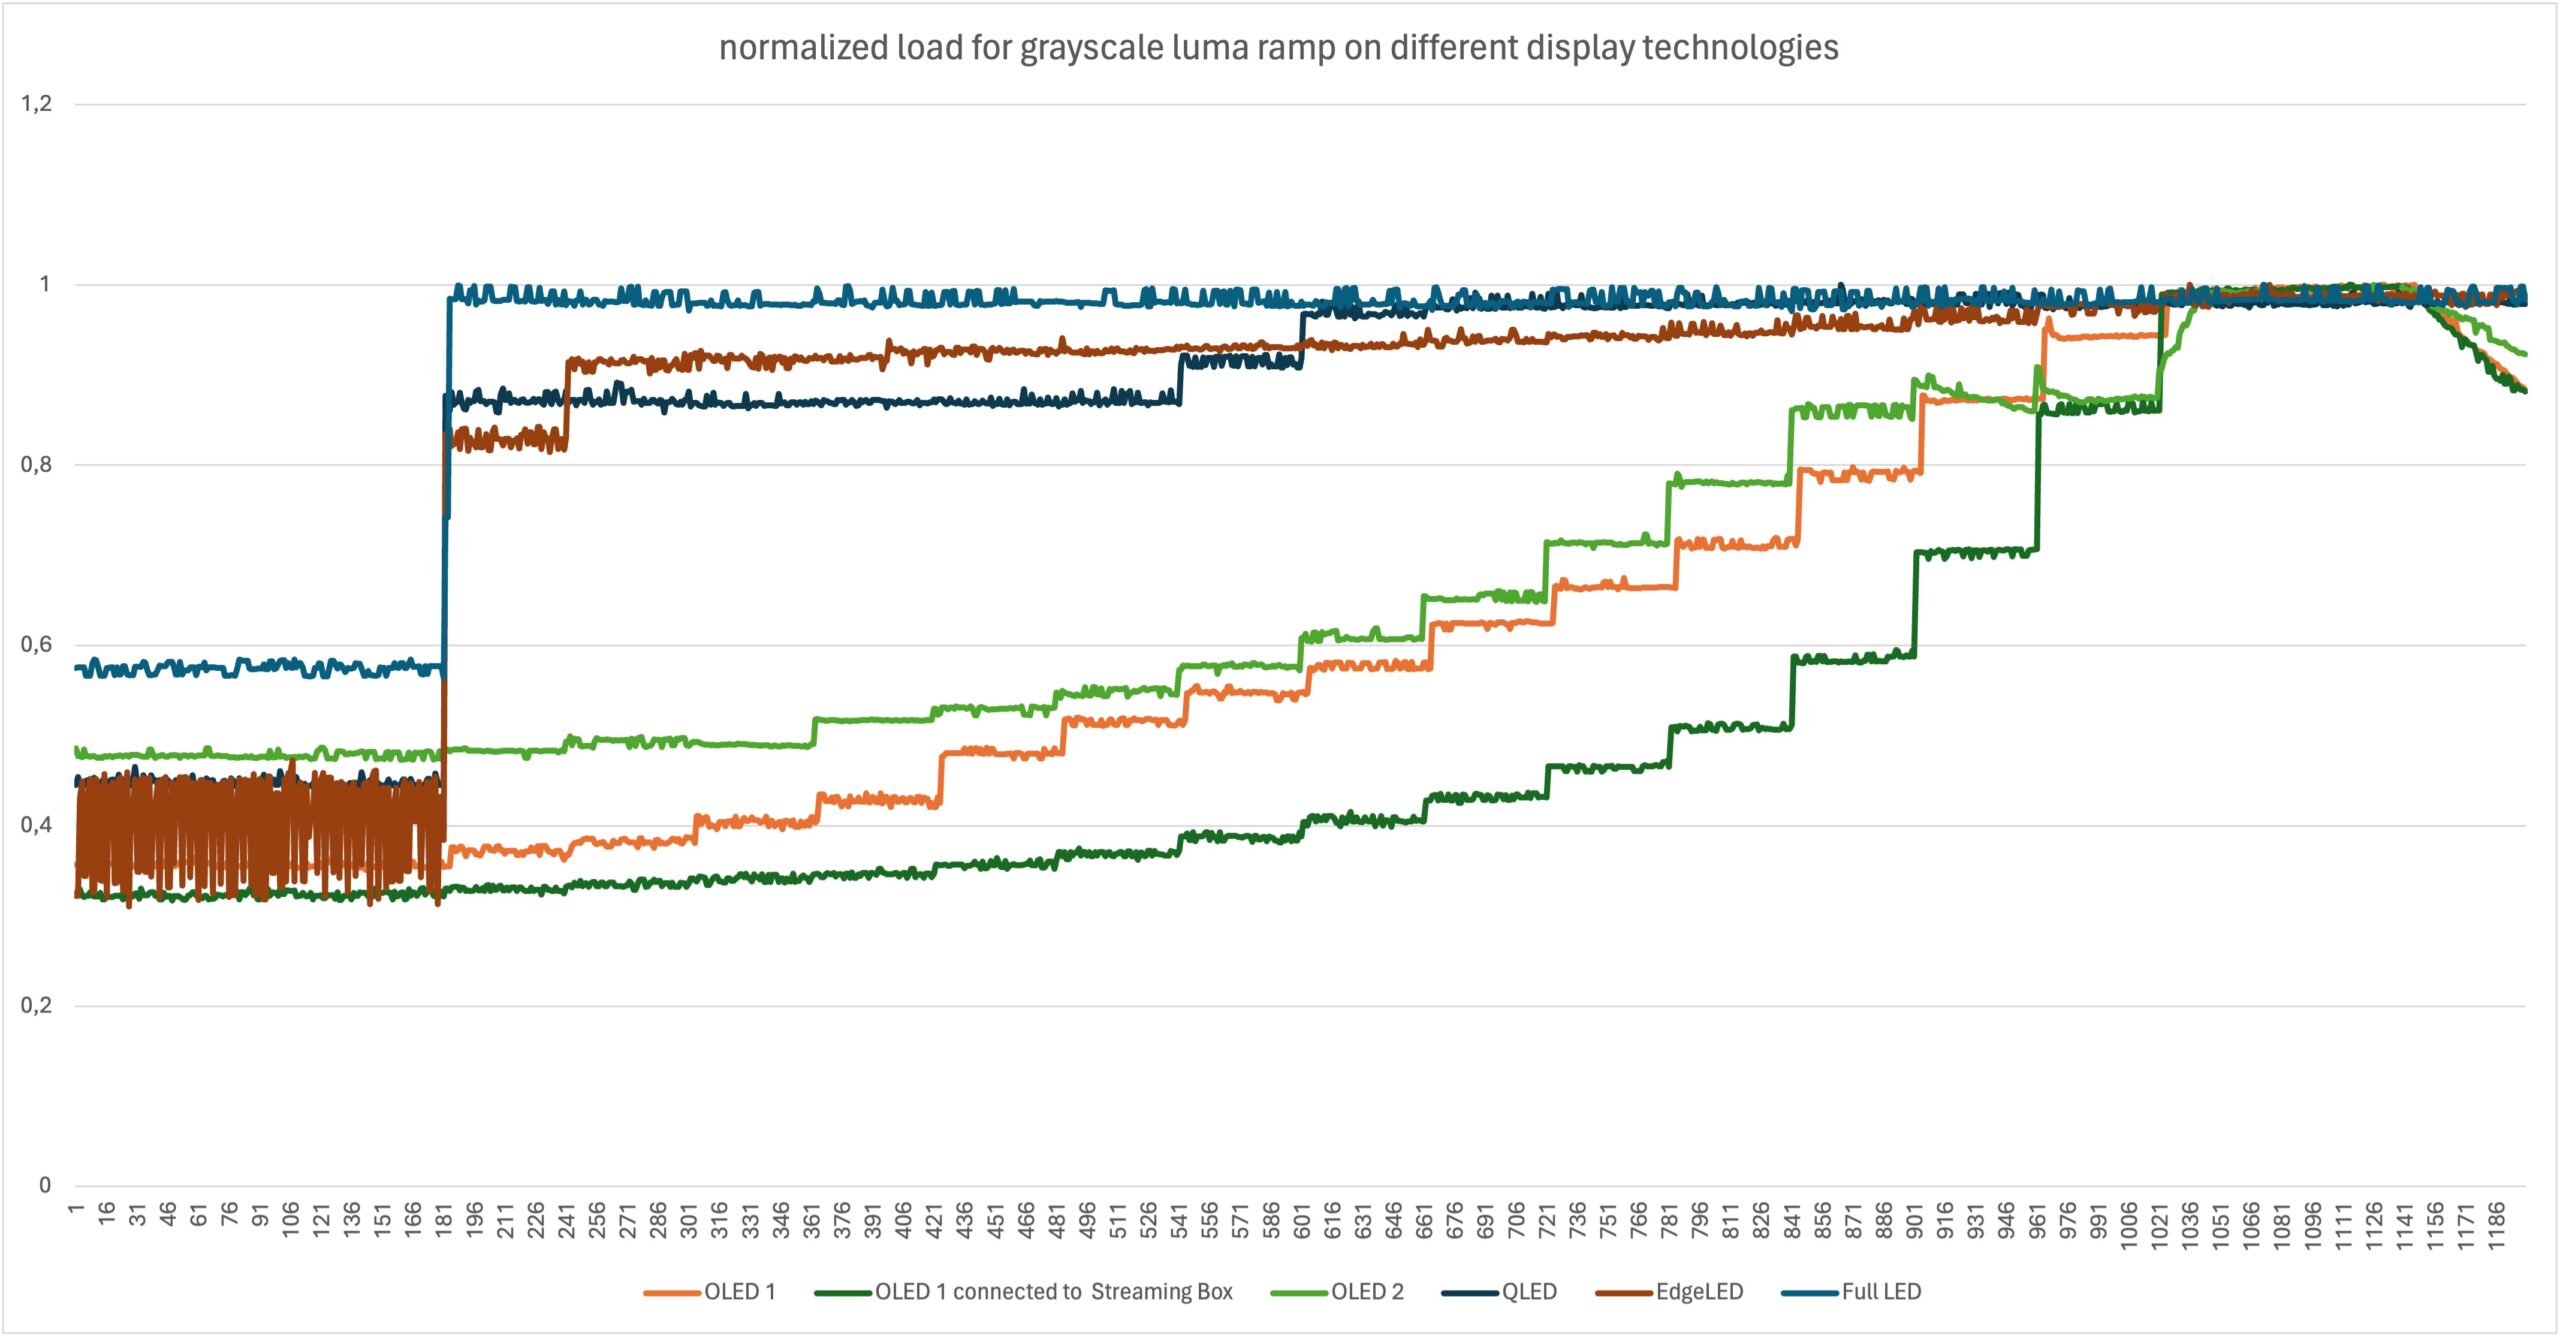
Fraunhofer FOKUS has supported and actively participated in the recent Hackathons of Greening of Streaming. The work of Greening of Streaming within Working Group 8 ‘End Devices’ has also demonstrated that content reflects a certain energy signature on end devices. These were demonstrated during the measurements of the ‘GoS Hackathon’ and could serve as a basis for the establishment, execution, and synchronization of widespread end-device measurements. Further details can be found in the report[1].To better compare the energy signatures, the curves are presented in a normalized form below:
Energy consumption of standalone Smart TV vs Streaming Box
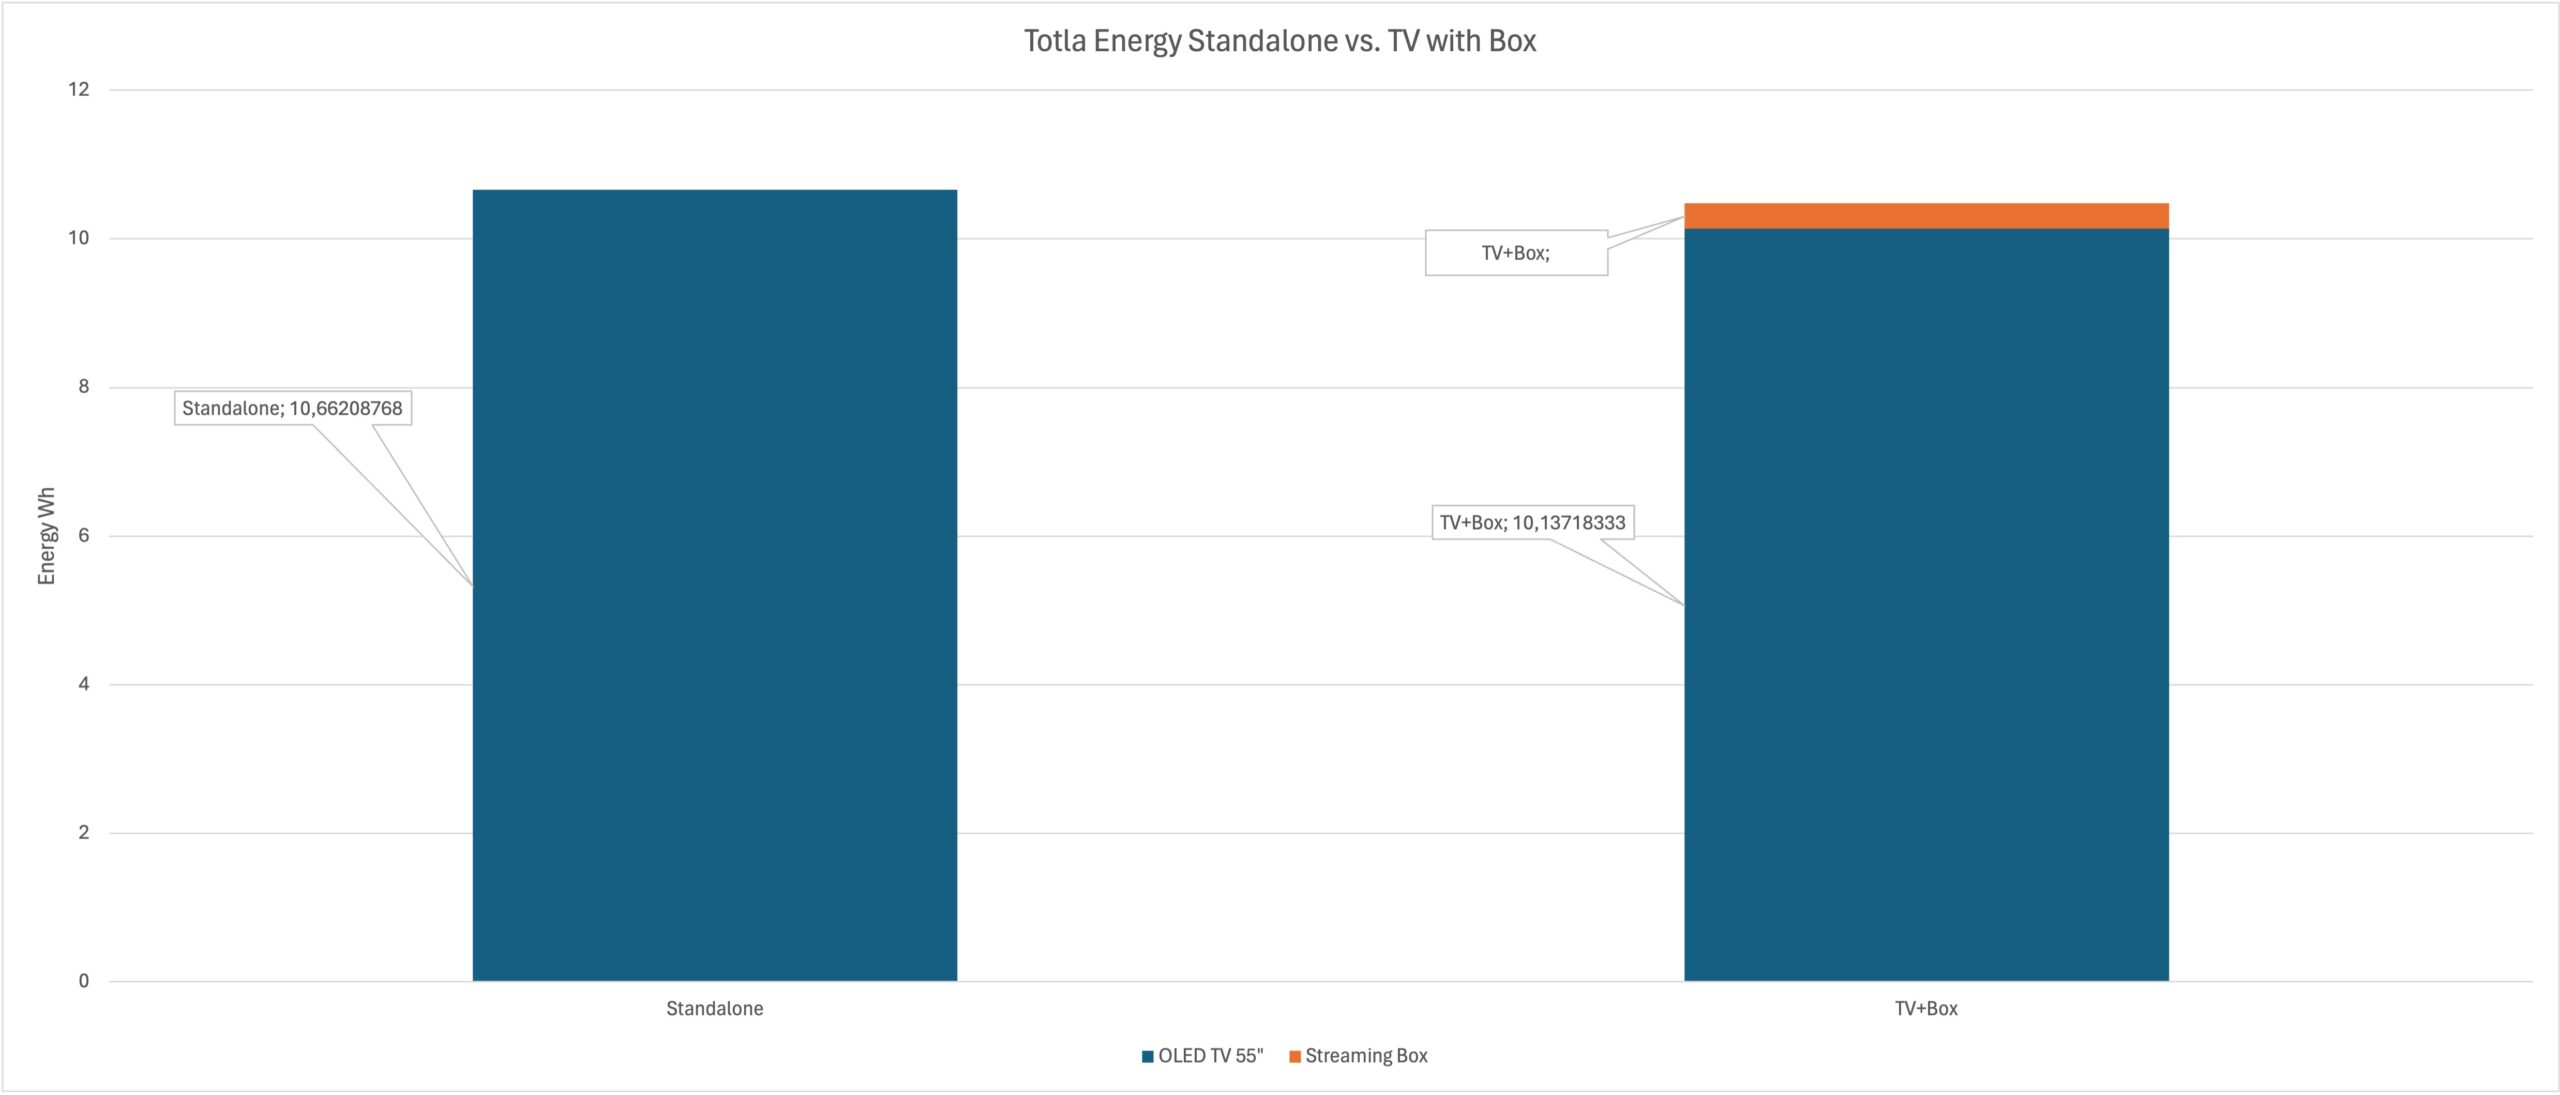
Considering the power consumption of a Smart TV connected to a streaming box via HDMI, receiving the display signal already in its processed version from the streaming box, two effects become apparent. In the test, the power consumption of the Smart TV with the connected streaming box decreased compared to the standalone measurement, where the Smart TV receives, decodes, and displays the content, even though it actually has fewer tasks to perform. This effect is explained by the settings of the streaming box, which itself brings various settings for image optimization, the HDR mode used, or energy savings. These settings affect the HDMI output signal sent to the Smart TV. In the case of the measurements presented, these settings had a relatively significant effect on the power consumption of the Smart TV, surpassing the additional power required for necessary processing steps such as network interface, content decoding, upscaler, etc. A comparative value can be determined based on the power consumption of the streaming box, which averaged approximately 3W in the test.
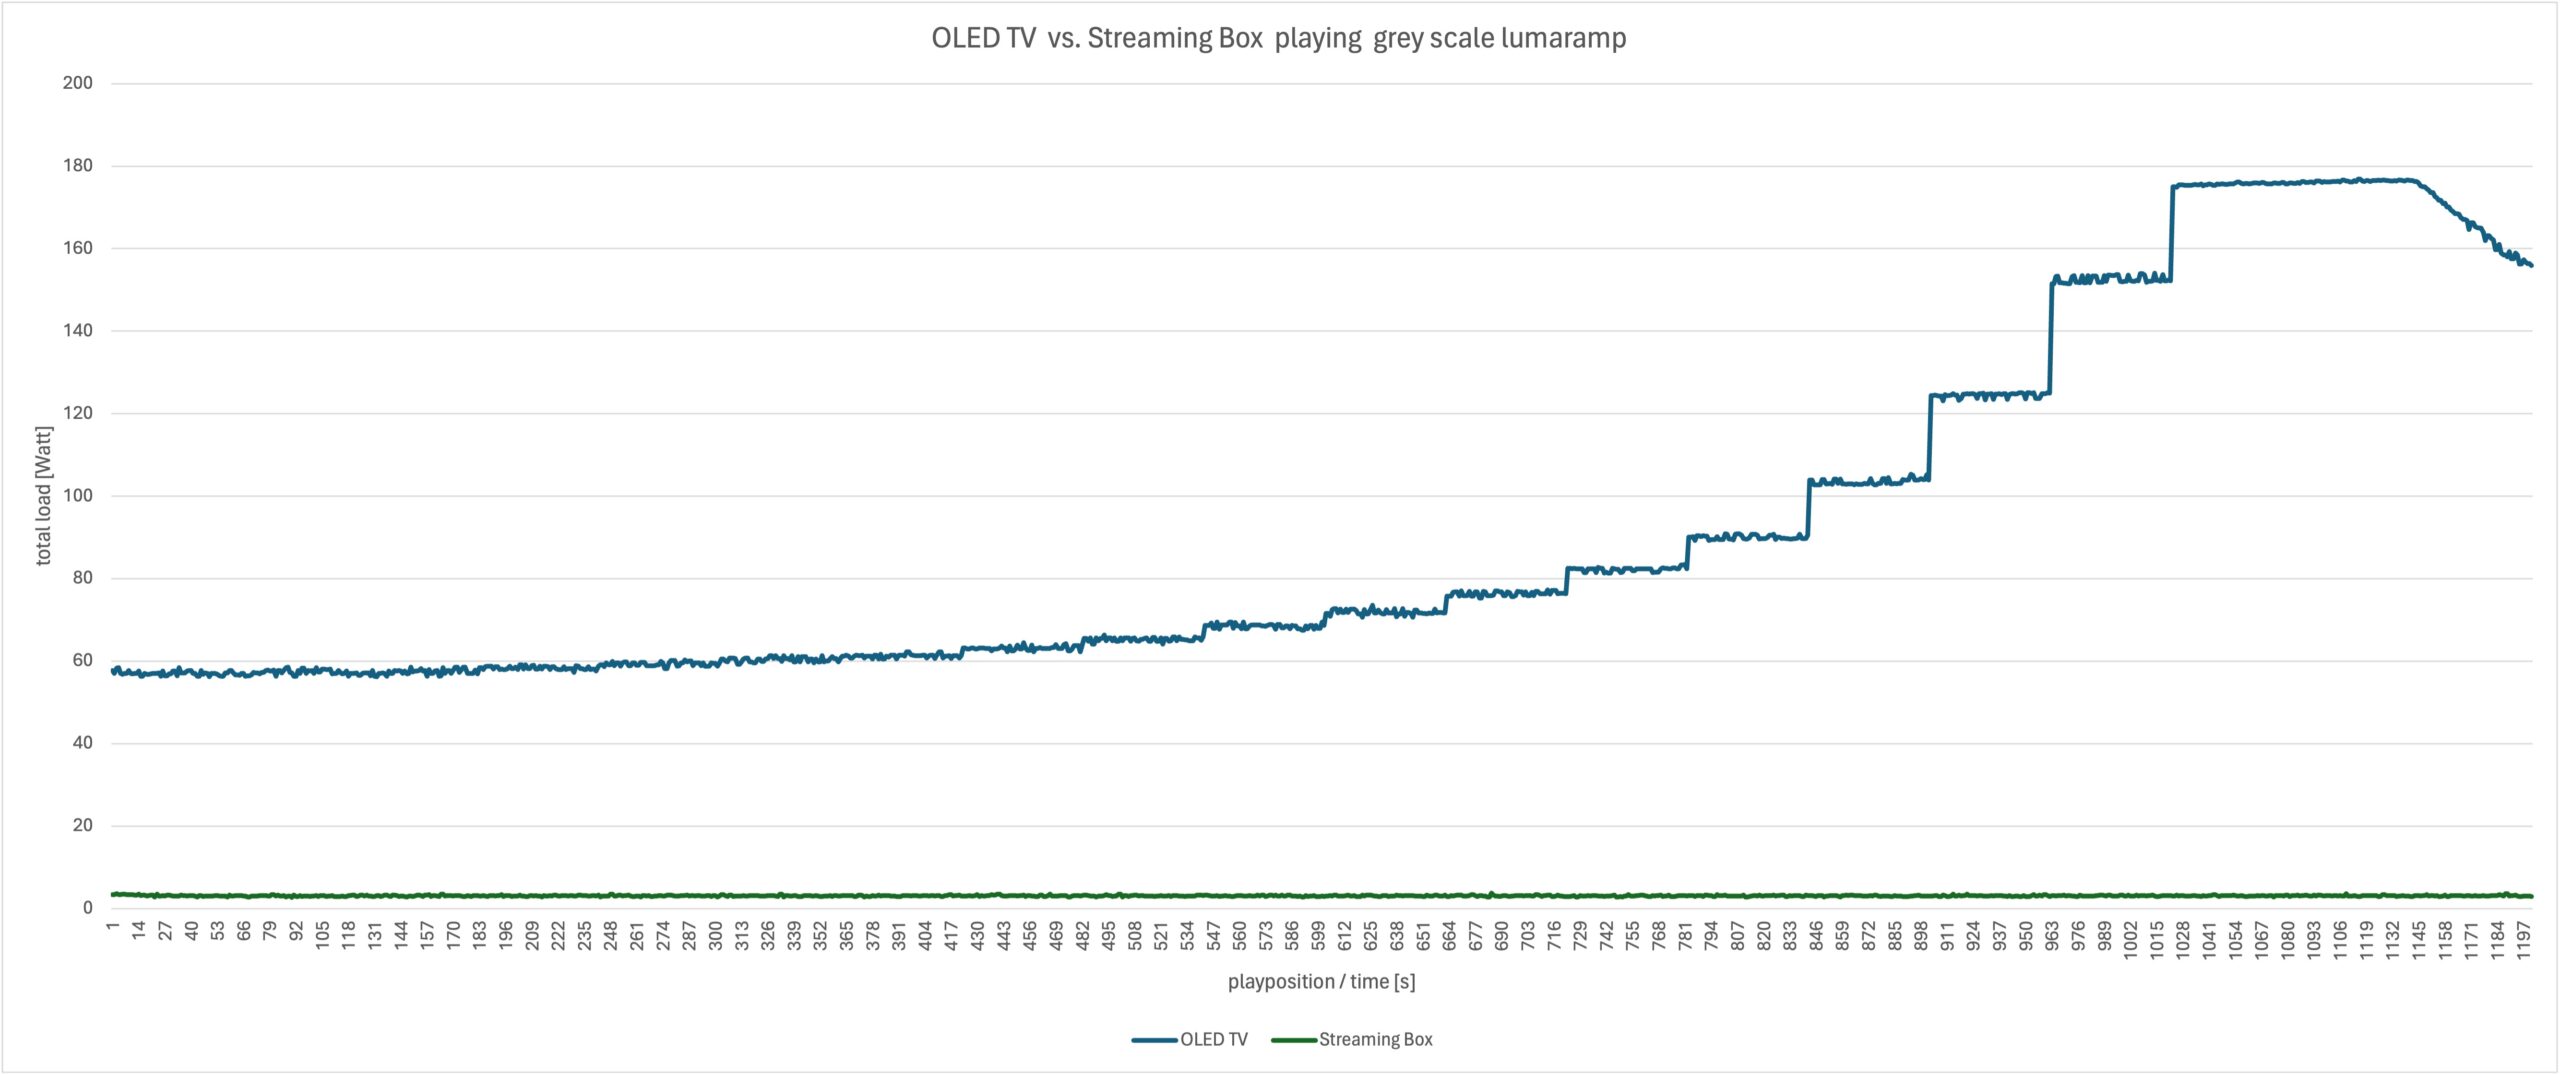
The comparison of energy consumption for the measured 20-minute streaming session reveals the proportions. The energy demand of the Smart TV dominates very clearly, almost entirely composed of the energy required for illuminating the display and the concurrently running basic functions of the Smart TV. Assuming the use case of a streaming box connected to the TV, this would mean that the potential energy savings during streaming, through changes in streaming parameters such as bitrate, resolution, codec, etc., are within the range of the maximum 3 watts that the streaming box requires for receiving and processing the signal. In contrast, in the specific example, there is up to 180 watts of power consumption for displaying bright content on the TV screen.
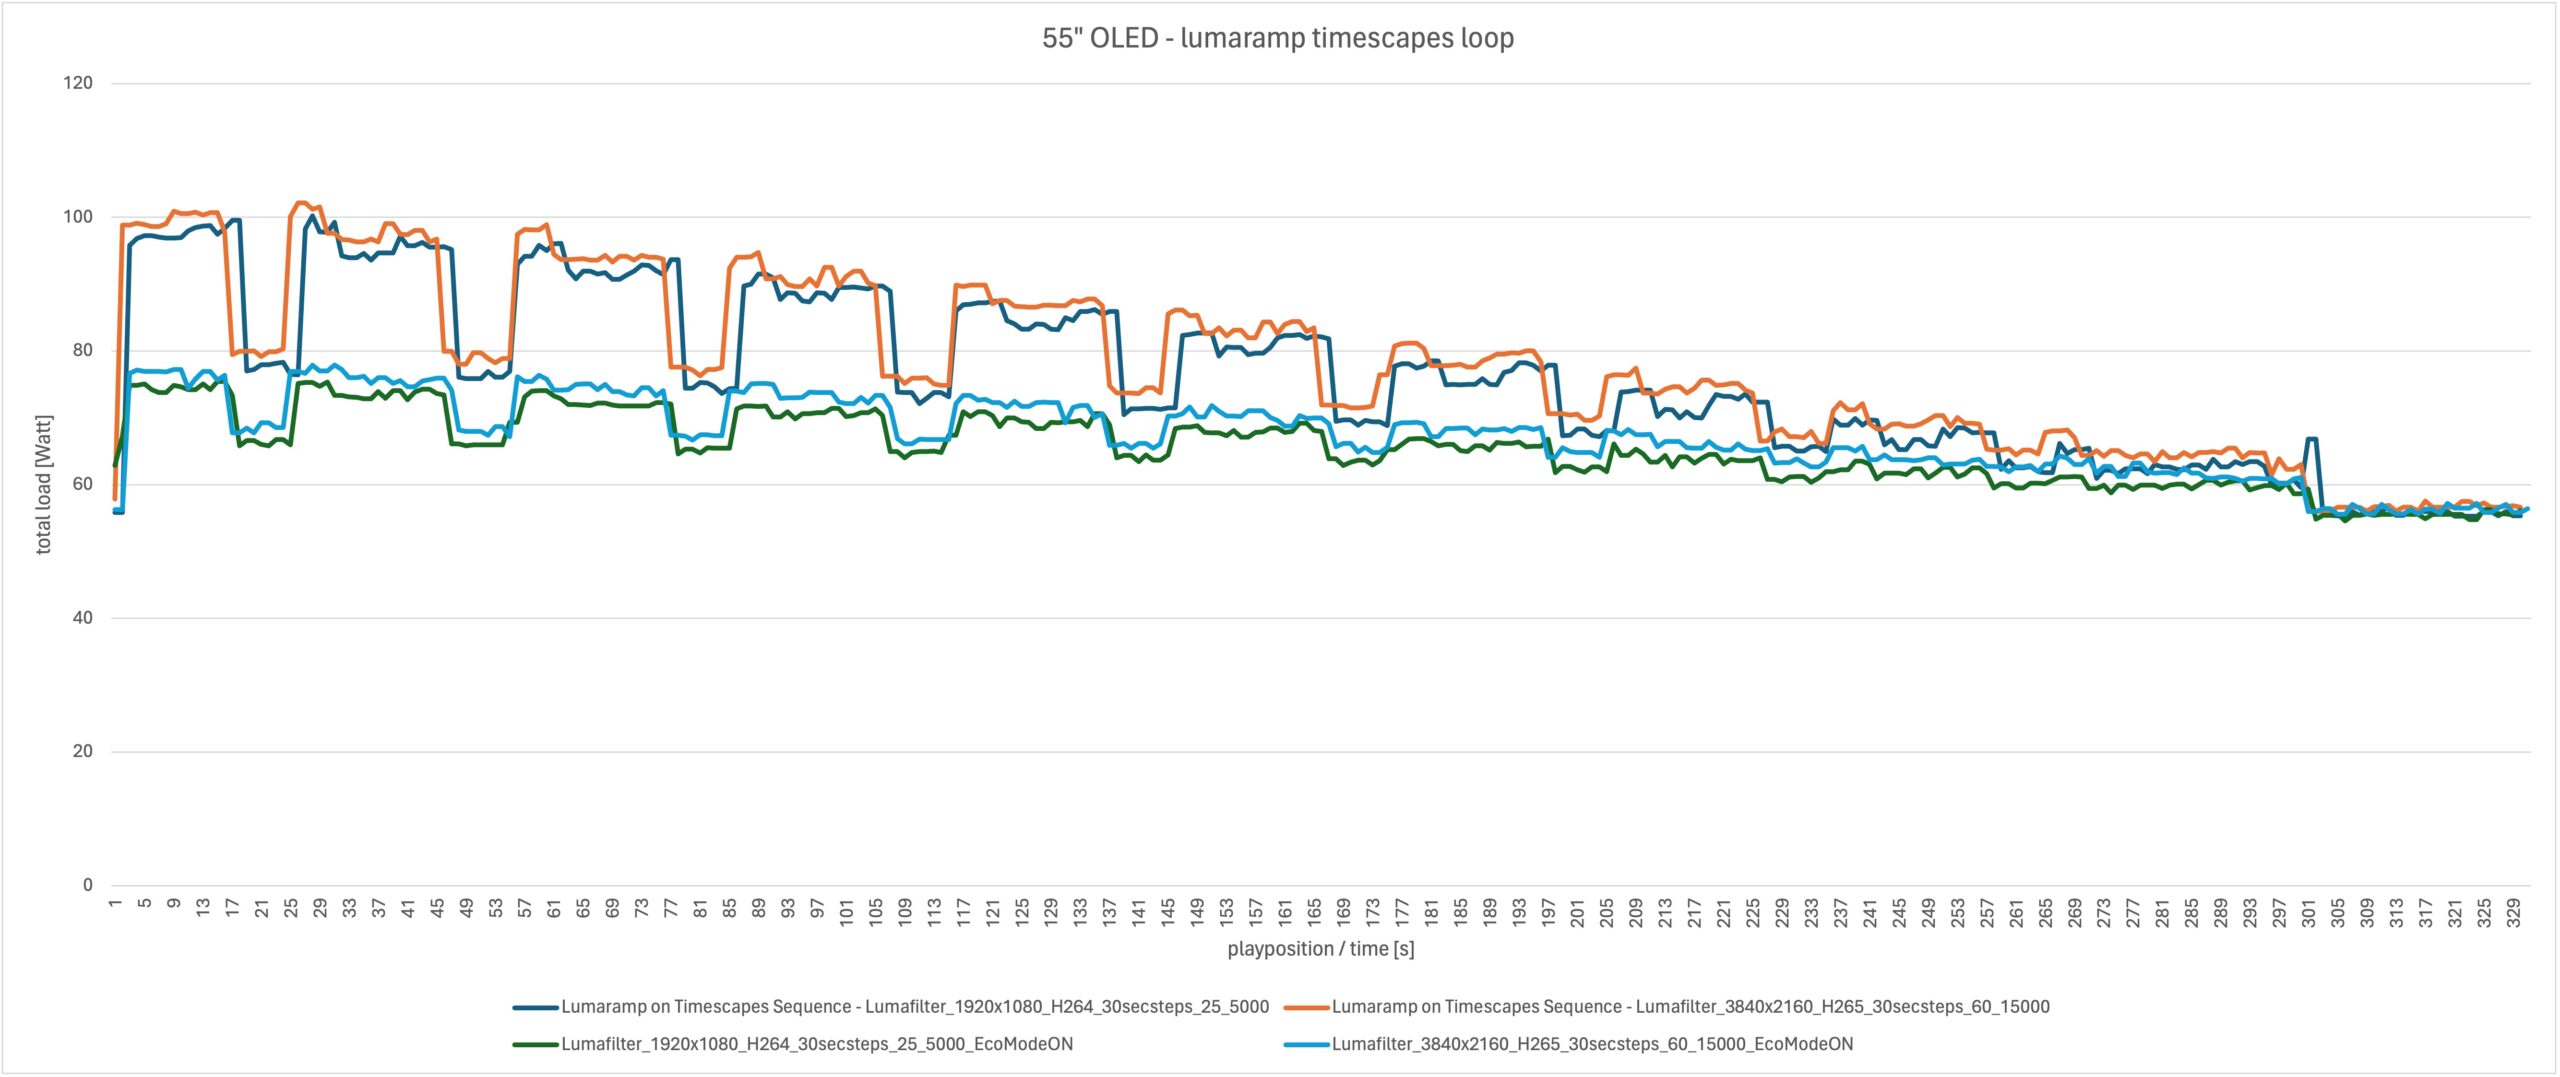
Further measurements with luma ramps on more realistic content
In addition to measurements based on the ‘grayscale lumaramp’ content, we conducted further measurements using the ‘timescapes lumaramp’ video. The power consumption of an OLED TV is illustrated in the following diagram. The power consumption is again directly related to the brightness of the content being displayed and decreases with increasing darkening of the content – here in intervals of 30 seconds. It is noteworthy that the different versions of the content used seems to have almost no measurable impact on energy consumption. Thus, the power consumption peaks differ only by a few watts between content specifications of 1920×1080 pixels, 25 FPS, and a bitrate of 5,000 kbit/s in H.264 compared to content with 3840×2160 pixels, 60 FPS, and a bitrate of 15,000 kbit/s. However, activating the energy-saving mode of the TV, which primarily reduces the brightness of the screen, can lead to energy savings of more than 20% in bright scenes.
Comparing different stream settings including bitrate, resolution
A very similar pattern emerges when evaluating the measurement results of the timescapes video, which, in contrast to the luma ramps, does not feature artificial brightness reduction. Here again, the power consumption of the TV is significantly influenced by the brightness of the respective scene in the content. This is particularly evident in the example of an OLED TV. Various stream configurations were created, and each was played and measured with the TV’s energy-saving mode disabled and enabled.
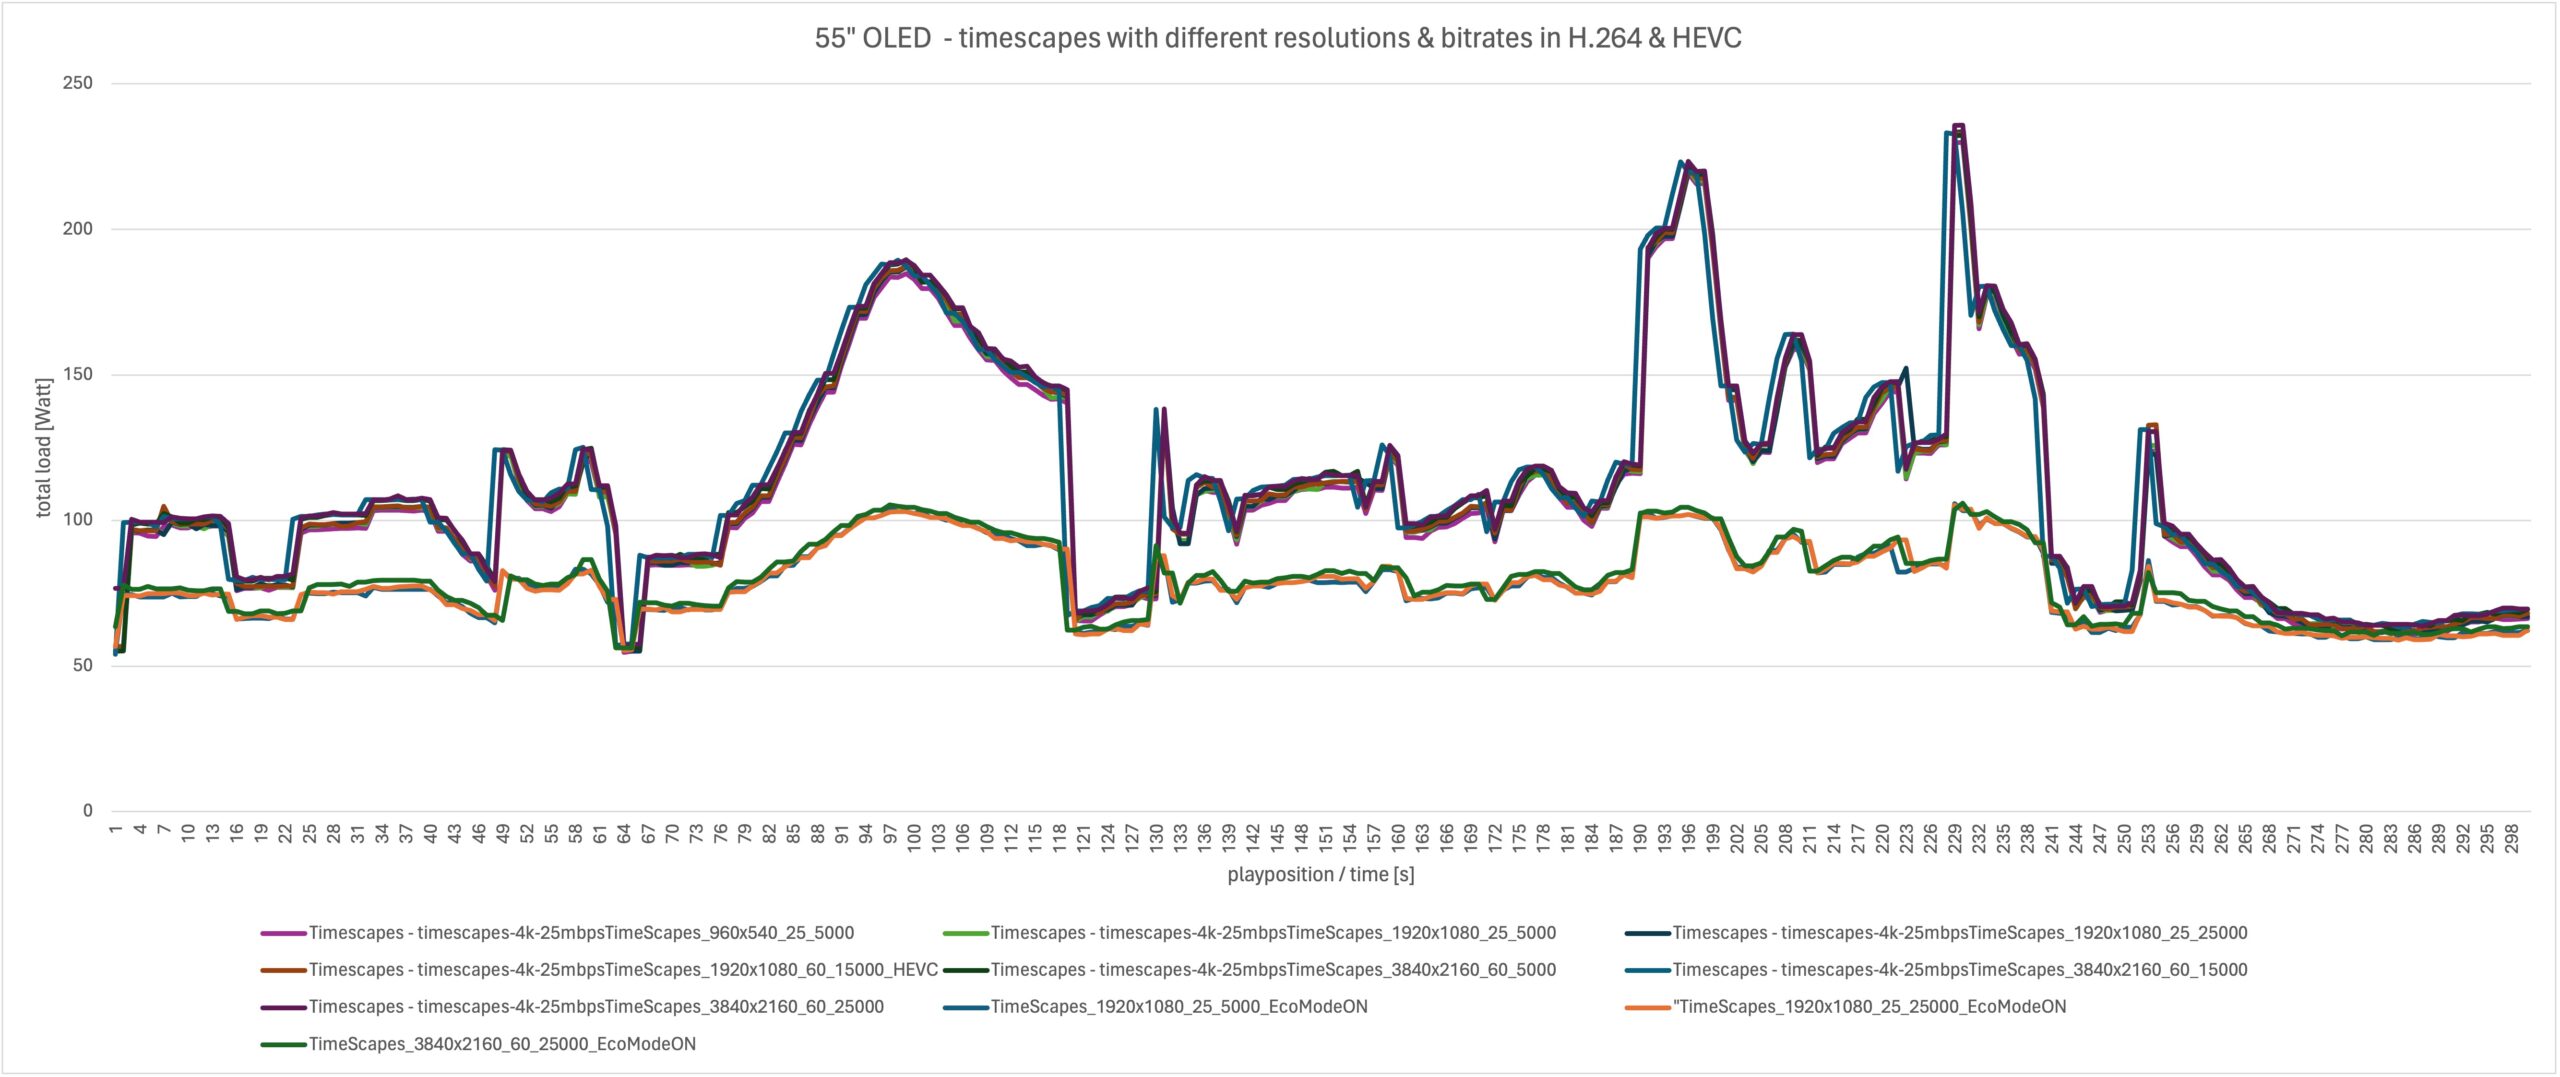
The differences in power consumption between the various renditions in SD, HD, and UHD with bitrates ranging from 5Mbps to 25Mbps are marginal and, compared to the brightness of the content, have almost no impact on the device’s energy consumption for streaming playback. On the other hand, activating the energy-saving mode results in energy savings of over 50% in individual scenes, surpassing the values obtained from the previously analyzed artificial content.
Let’s do the math and try to illustrate the potential savings through modification of stream parameters based on an example:
The difference in measured energy consumption for our OLED 55″ TV, playing the 5-minute test content at 960×540@25fps@5000kbps and at 3840×2160@60fps@25000kbps, was 0.026863489 Wh. If we extrapolate the energy consumption of these 5 minutes to a daily usage of 5 hours of streaming for 365 days, the total energy difference amounts to 588.31 Wh, or 0.58831 kWh. Yes, we can extrapolate this value to millions of households and users, but it remains just the famous drop in the bucket.
To make it even more practical: at an assumed price of 30 cents per kWh, this results in a saving of 0.18€ per year…
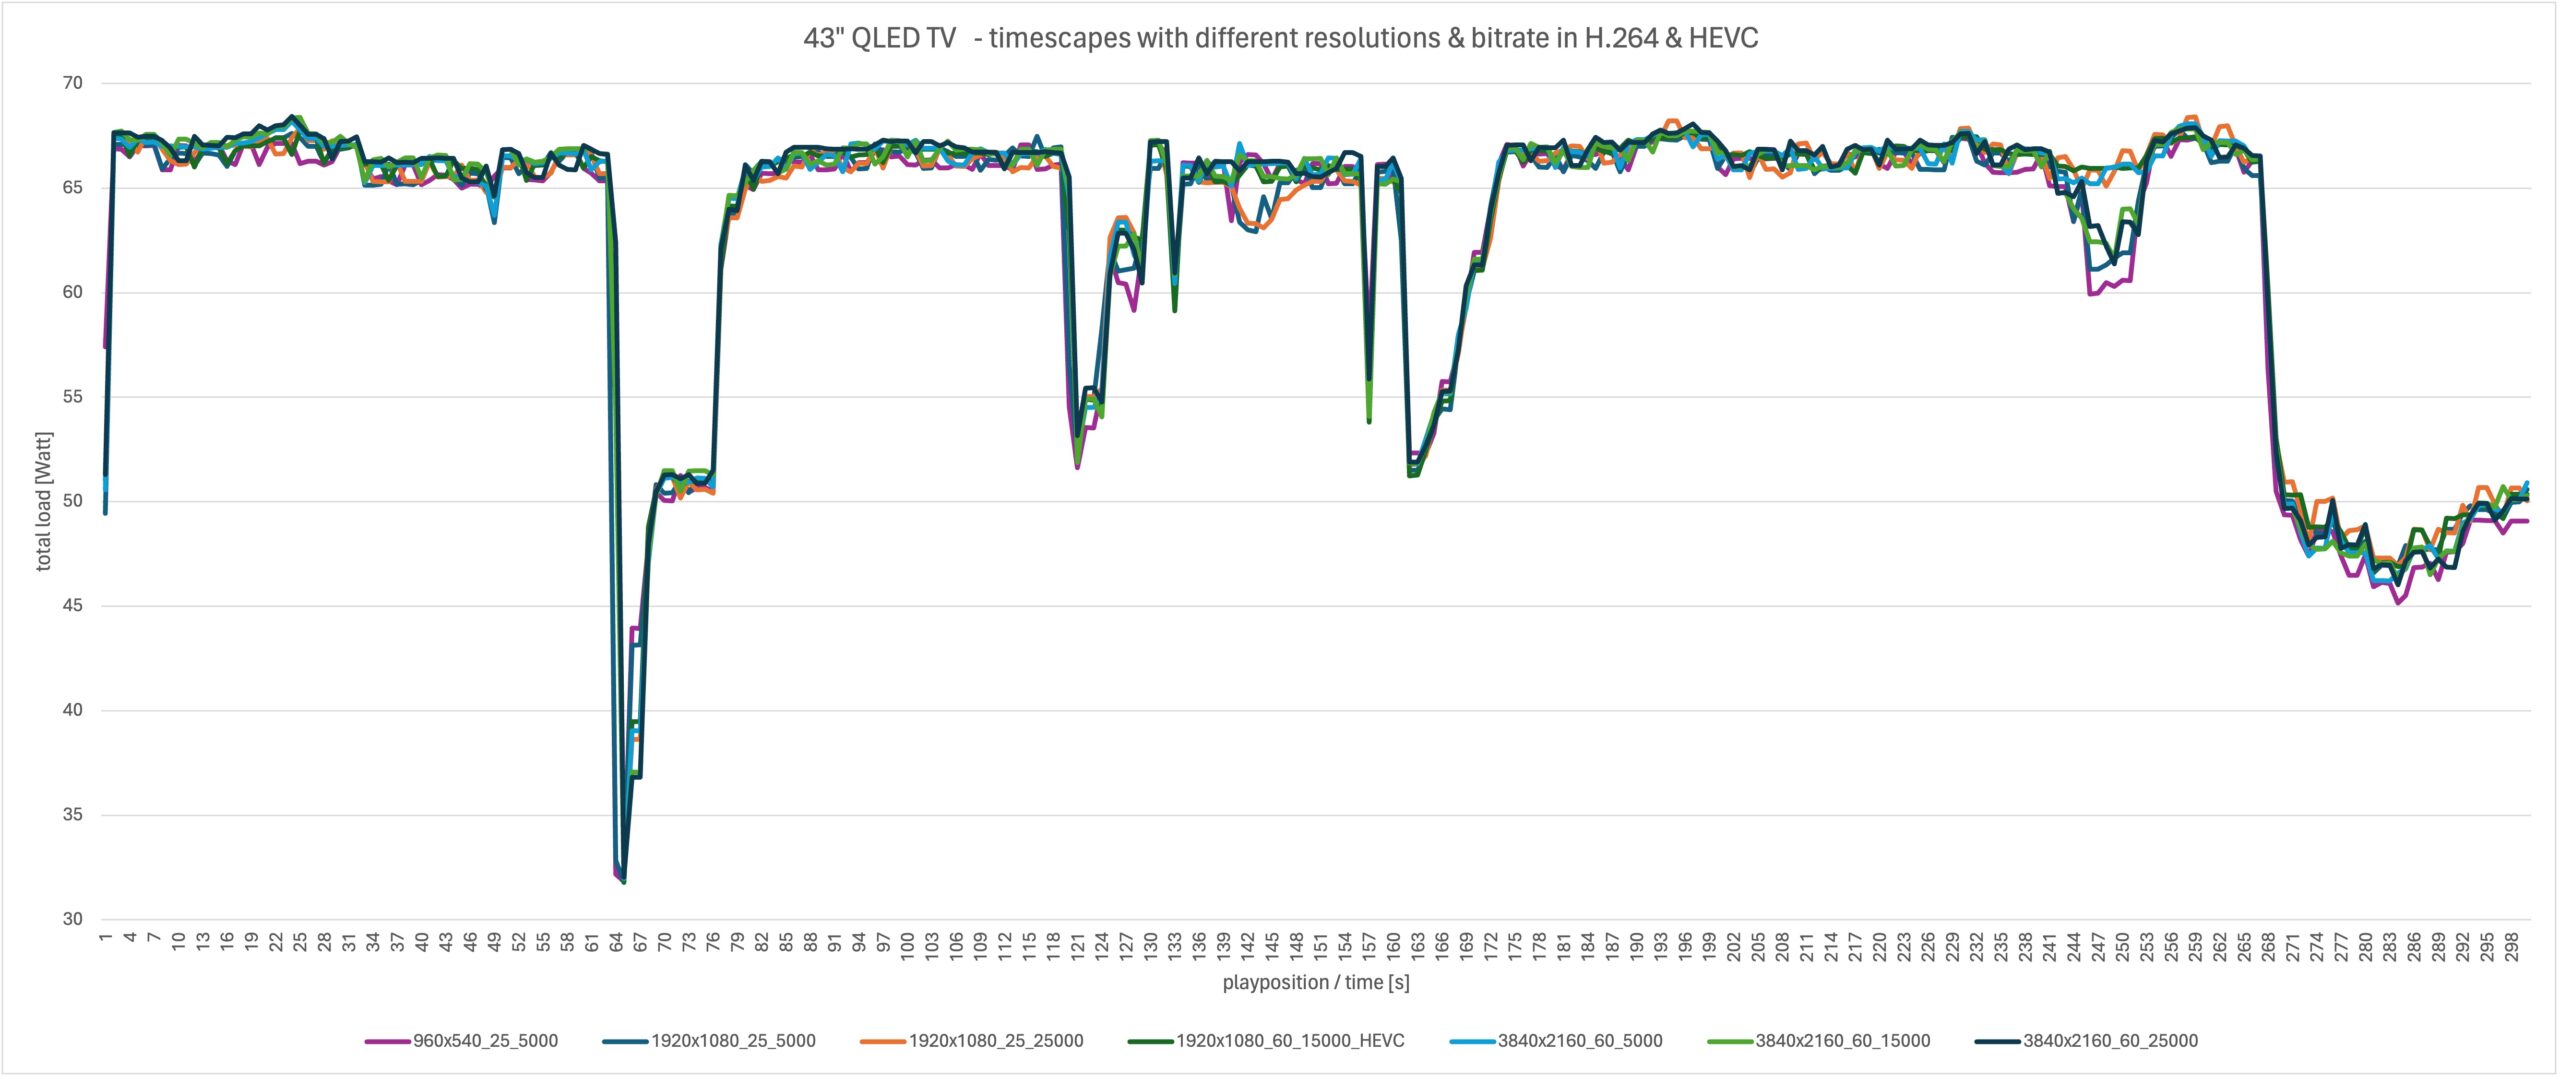
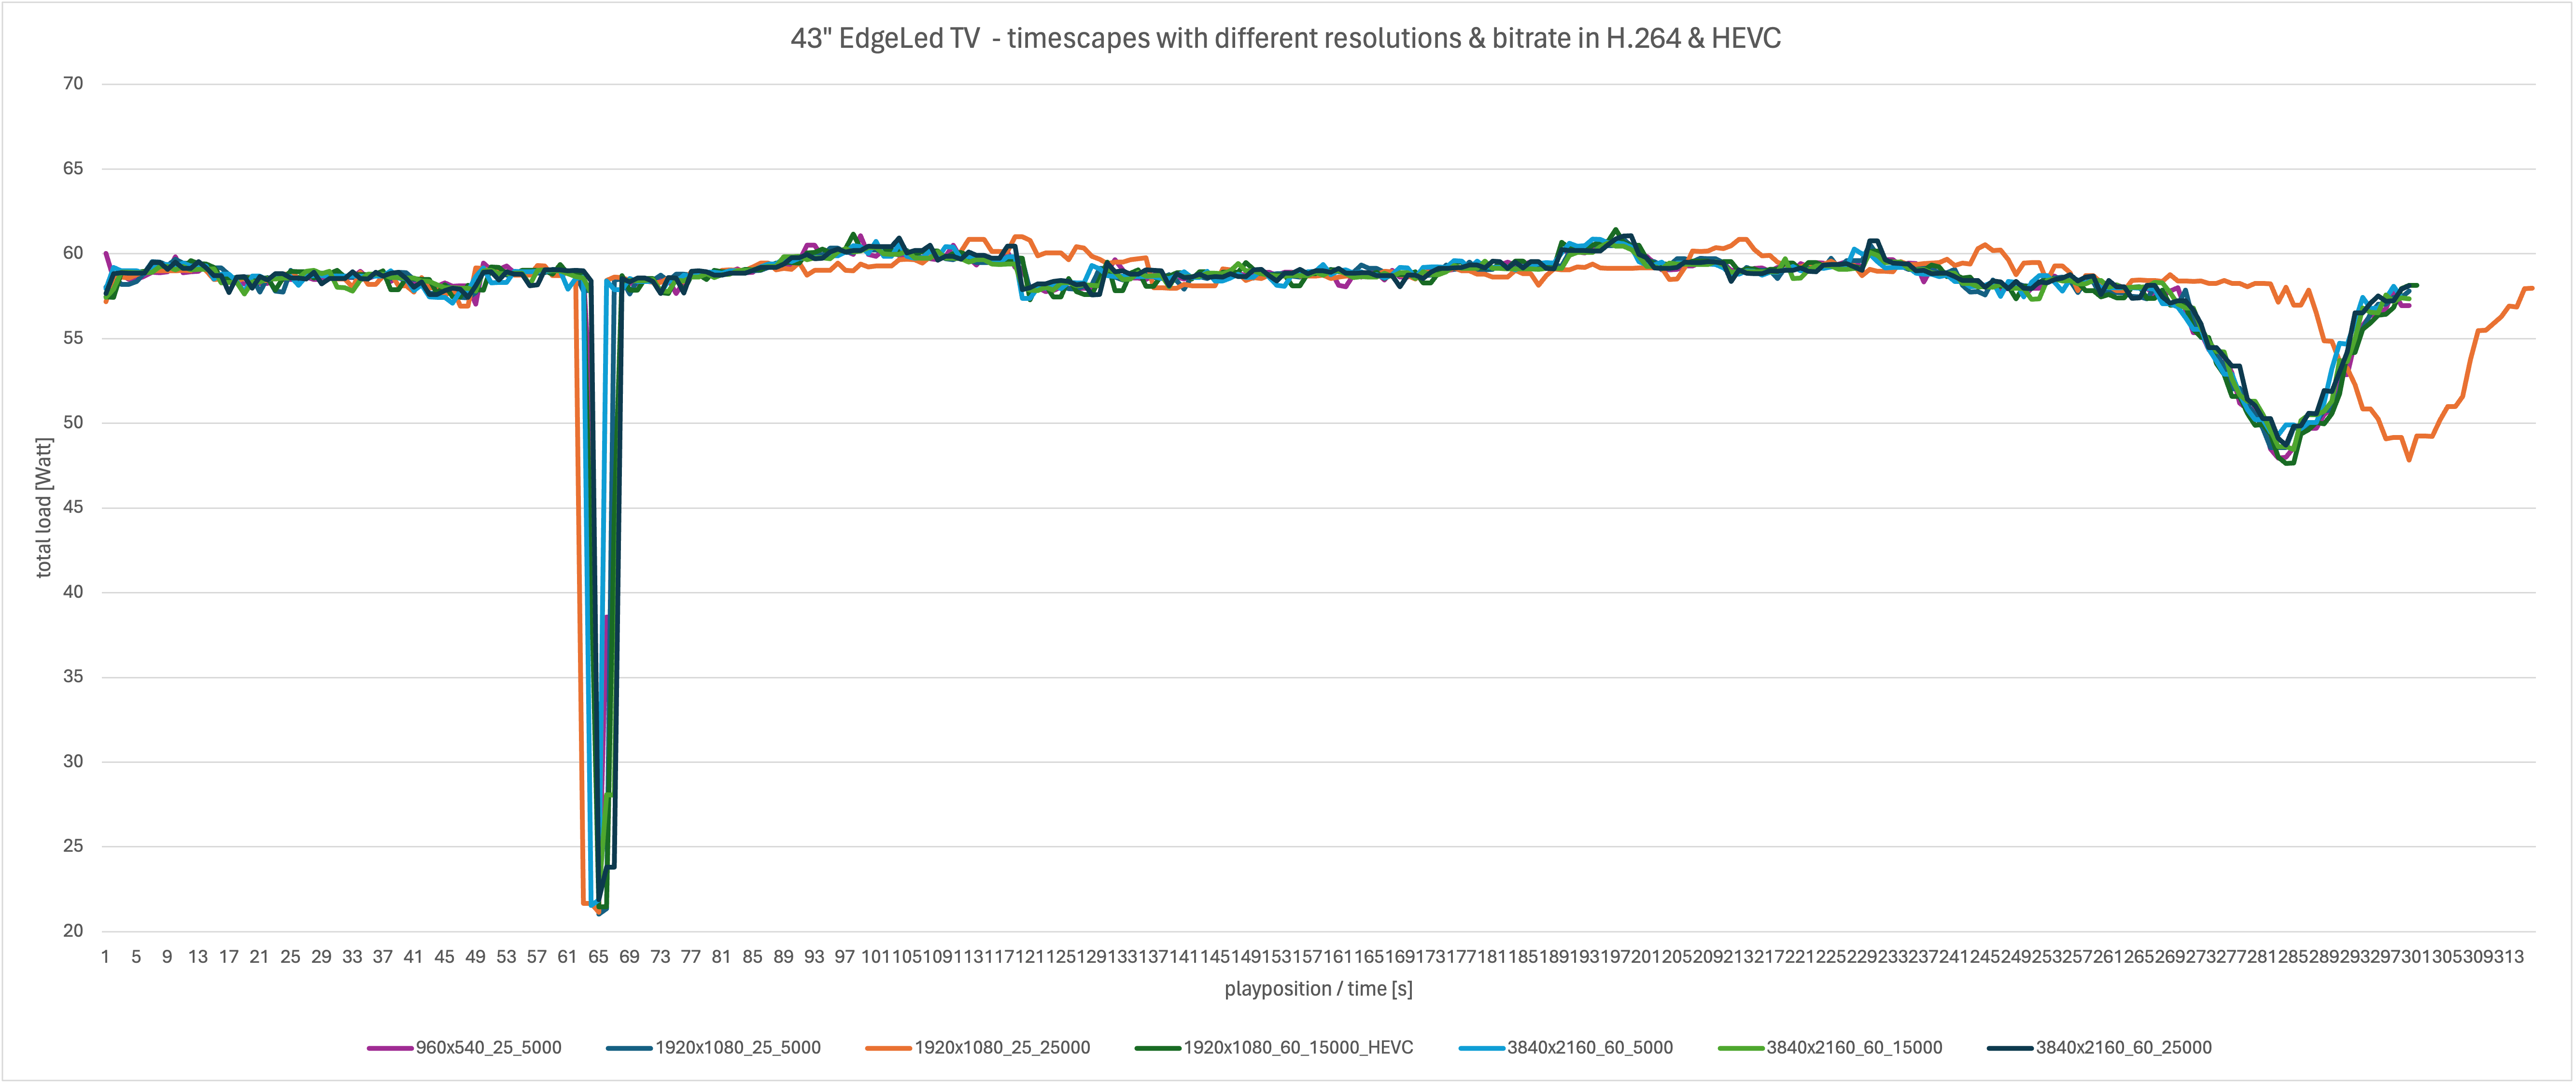
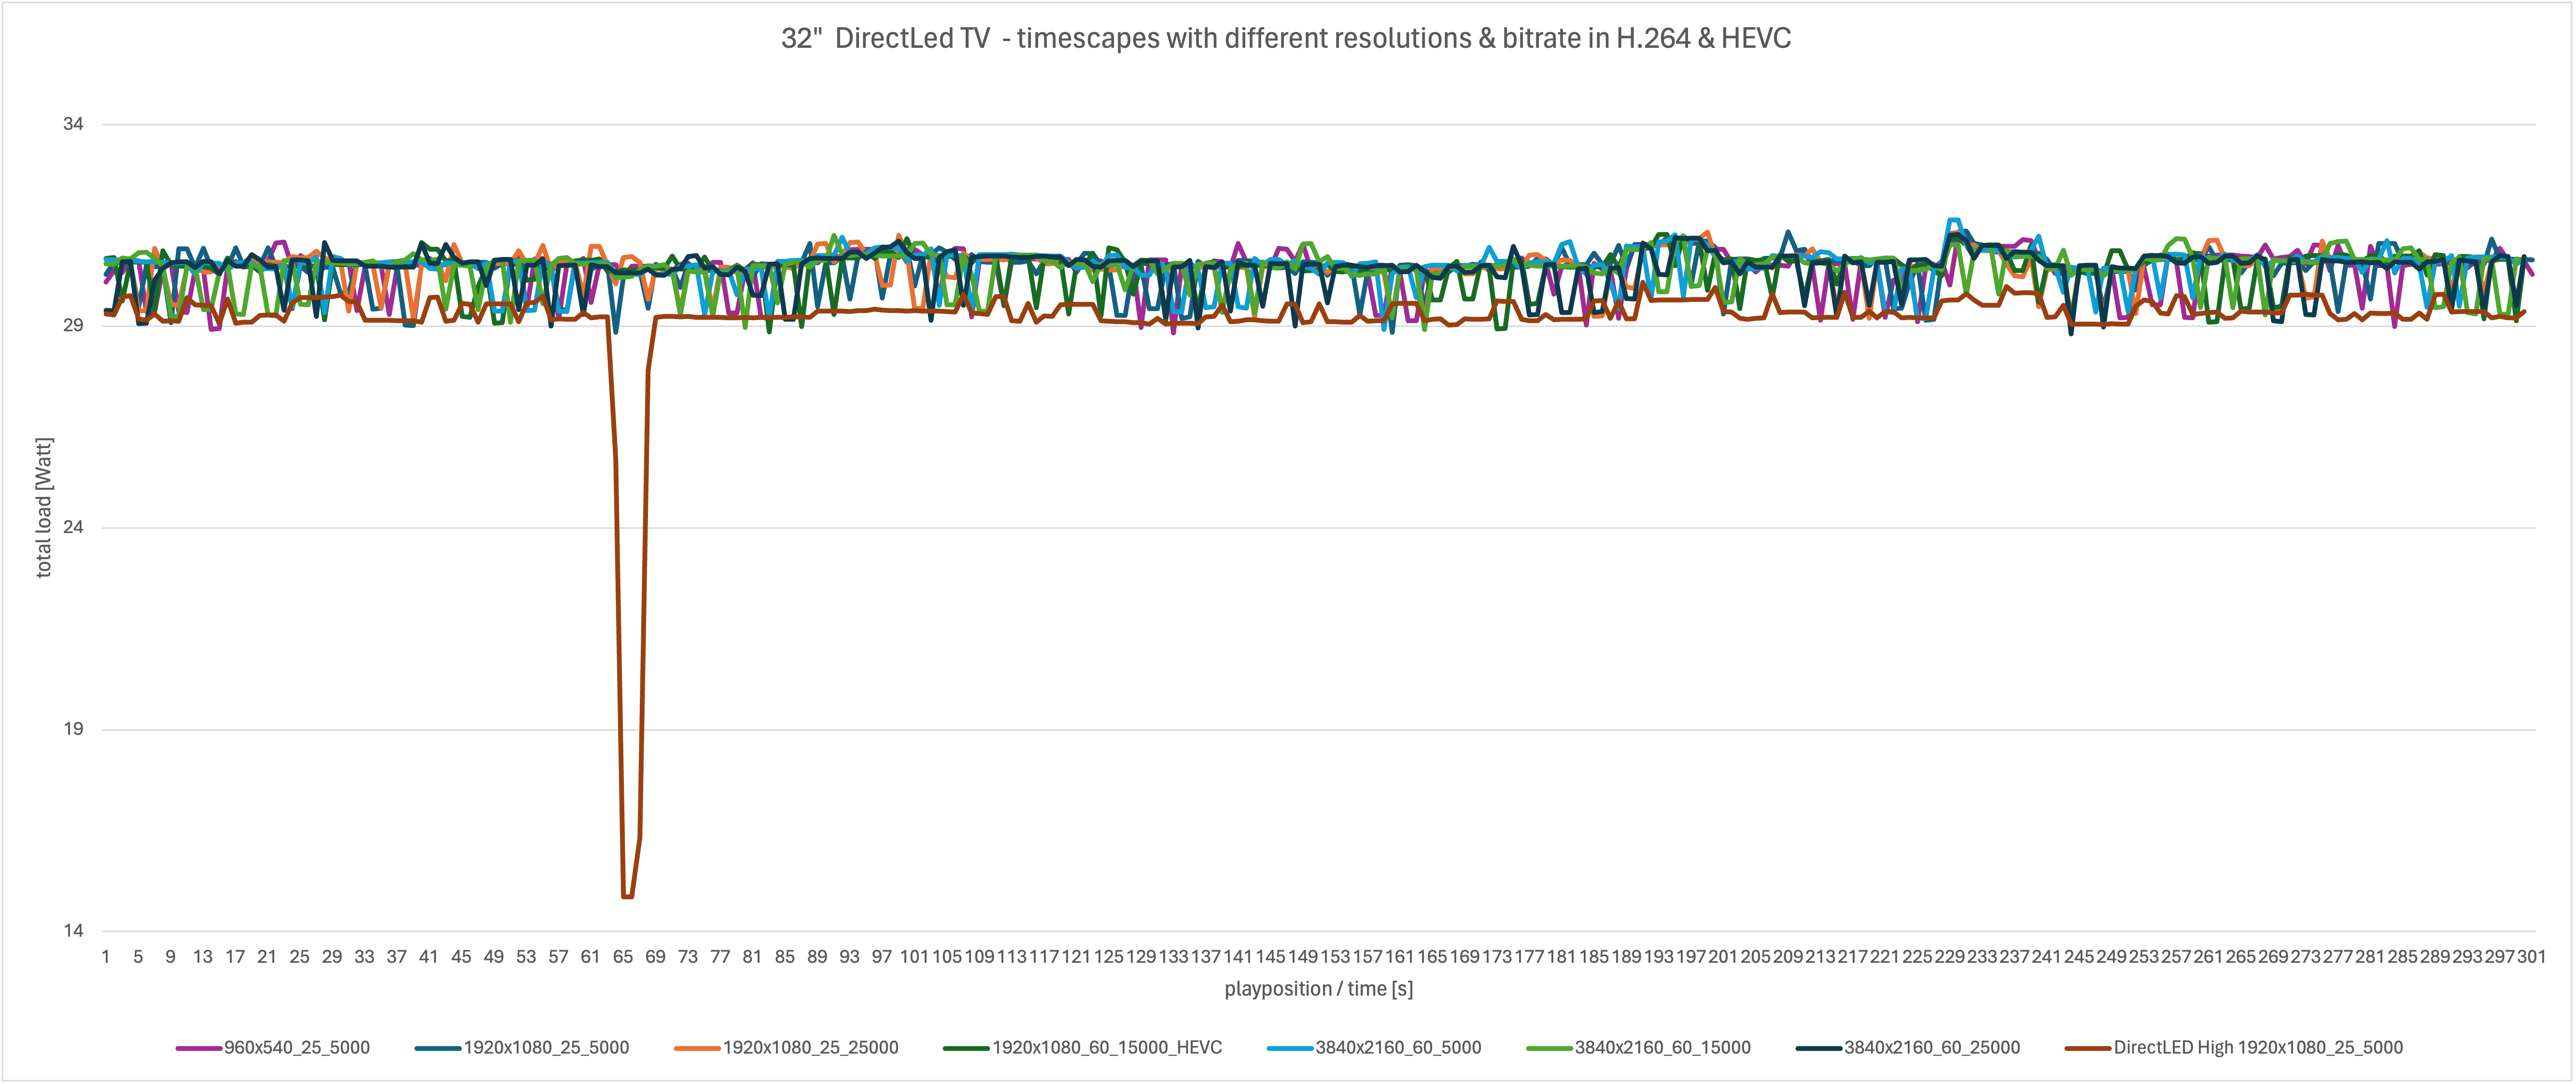
Additional measurements on QLED. Edge Led, Direct Led TVs
For completeness, the graphs below depict the power consumption of the other measured TVs with QLED, Edge Led, and Direct Led display technologies.
Measurements with random pixel content
Compared to the realistic timescapes content, the random pixel content reveals a difference in power consumption between UHD and HD content in the measured OLED TV, of approximately 8-10%. At the same time, it is confirmed here as well that the bitrate used does not show a significant effect. The increased power consumption when playing UHD content could be attributed to the overall computational load on the TV, as the test content poses extreme and almost unrealistic demands on video processing. Substantial savings, however, are only achievable with the activation of the TV’s energy-saving mode (reducing brightness). The savings potential is even significantly higher in the considered extreme example than through modification of the stream itself.
What have we learned so far?
Our measurements and analyses have revealed how various stream parameters, content characteristics, and different display technologies impact the energy consumption of end devices during streaming. In the concluding Part 3 of our blog post series, we will take a closer look at the results and discuss solutions like FAMIUM GreenView that leverage these effects for a more energy-efficient and sustainable streaming.
Curious about our activities in green streaming? Explore green-streaming.de for details and reach out to us!
contributing authors: Robert Seeliger, Minh Nguyen, Martin Lasak, Görkem Güclü, Daniel Silhavy
[1] https://www.greeningofstreaming.org/post/gos-hackathons-develop-scalable-energy-measurement-for-consumer-media-electronics