
During the WWDC 2021 conference, Apple announced a new tool called Advanced Video Quality Tool (AVQT):
“AVQT is a macOS command line tool, which estimates perceptual quality of compressed videos, that might contain video coding and scaling artifacts”. [1]
Similarly to video quality metrics like peak signal-to-noise ratio (PSNR) and Video Multi-Method Assessment Fusion (VMAF), AVQT scores are used as a reference metric. This means that the AVQT uses the source video as a reference in order to calculate the quality score for the compressed video. The quality scores range from 1 (low quality) to 5 (high quality), just like the mean opinion score (MOS) scale.
In this blog post, we will answer the following questions:
- How can we use AVQT to calculate the quality of an encoded video?
- Do different types of content require different bitrates to achieve a certain AVQT score?
- How can we derive the optimal encoding ladder for a video using AVQT?
- What are the problems and challenges that arise when using AVQT?
In order to answer these questions, we need a well-defined set of test videos, such as the Waterloo IVC 4K Video Quality Database [2].
The database “is created from 20 pristine 4K (Resolution: 3840×2160) videos, all collected from YouTube creative commons videos. Each source video is encoded by five encoders: HEVC, H264, VP9, AV1 and AVS2. Each source video is encoded into three resolutions: 960×540, 1920×1080, 3840×2160. Each setting has four distortion levels, where the encoder control parameters were decided to ensure a good perceptual separation“.
For our tests, we focused on H264 as the target codec. As the Waterloo IVC 4K Video Quality Database is listed as one of the reference datasets in the AVQT README, we can expect this to work well with AVQT.
Calculating AVQT scores
Let’s start with a simple task: how can we use AVQT to calculate the quality of an encoded video? As previously described, AVQT is a reference metric, which means that we need the source and encoded videos in order to calculate the corresponding AVQT score. Since AVQT is a simple command line tool, the usage is very straight forward. In order to calculate the AVQT scores for all 20 source videos and their respective encodes, we wrote a small batch script:
#!/bin/bash

echo "Bash version ${BASH_VERSION}..."

for i in {1..20}
  do
    echo "Starting to process video $i"
    mkdir ./results/$i
      for j in {1..4}
        do
          echo "Starting to calculate scores for 960x540_$j"
          AVQT --test H264/$i/960x540_$j.mp4 \
               --reference source/$i.mp4 \
               --metrics AVQT \
               --display-resolution 3840x2160 \
               --viewing-distance 1.5H \
               --output ./results/$i/960x540_$j.csv
        done
   done
The script iterates over the 20 source videos and calculates the four AVQT scores for each of the three resolutions. For means of simplicity, the code snippet above only shows the command for the 960×540 resolution. The individual AVQT commands use the following parameters:
- –test: defines the path to the encoded video
- –reference: defines the path to the reference video
- –metrics: defines the metrics to be calculated. In this case, we are only calculating the AVQT scores. The tool itself supports PSNR and MSE as well.
- –display-resolution: resolution of the display
- –viewing-distance: viewing distance in multiples of display height. We choose 1.5H to align with the VMAF 4k model.
- –output: path to the results file
AVQT scores for different types of content
Now that the AVQT scores have been calculated, we can compare the individual scores. Figures 1 – 3 illustrate the AVQT scores (arithmetic mean of all frames) of all three resolutions for each of the 20 test videos.
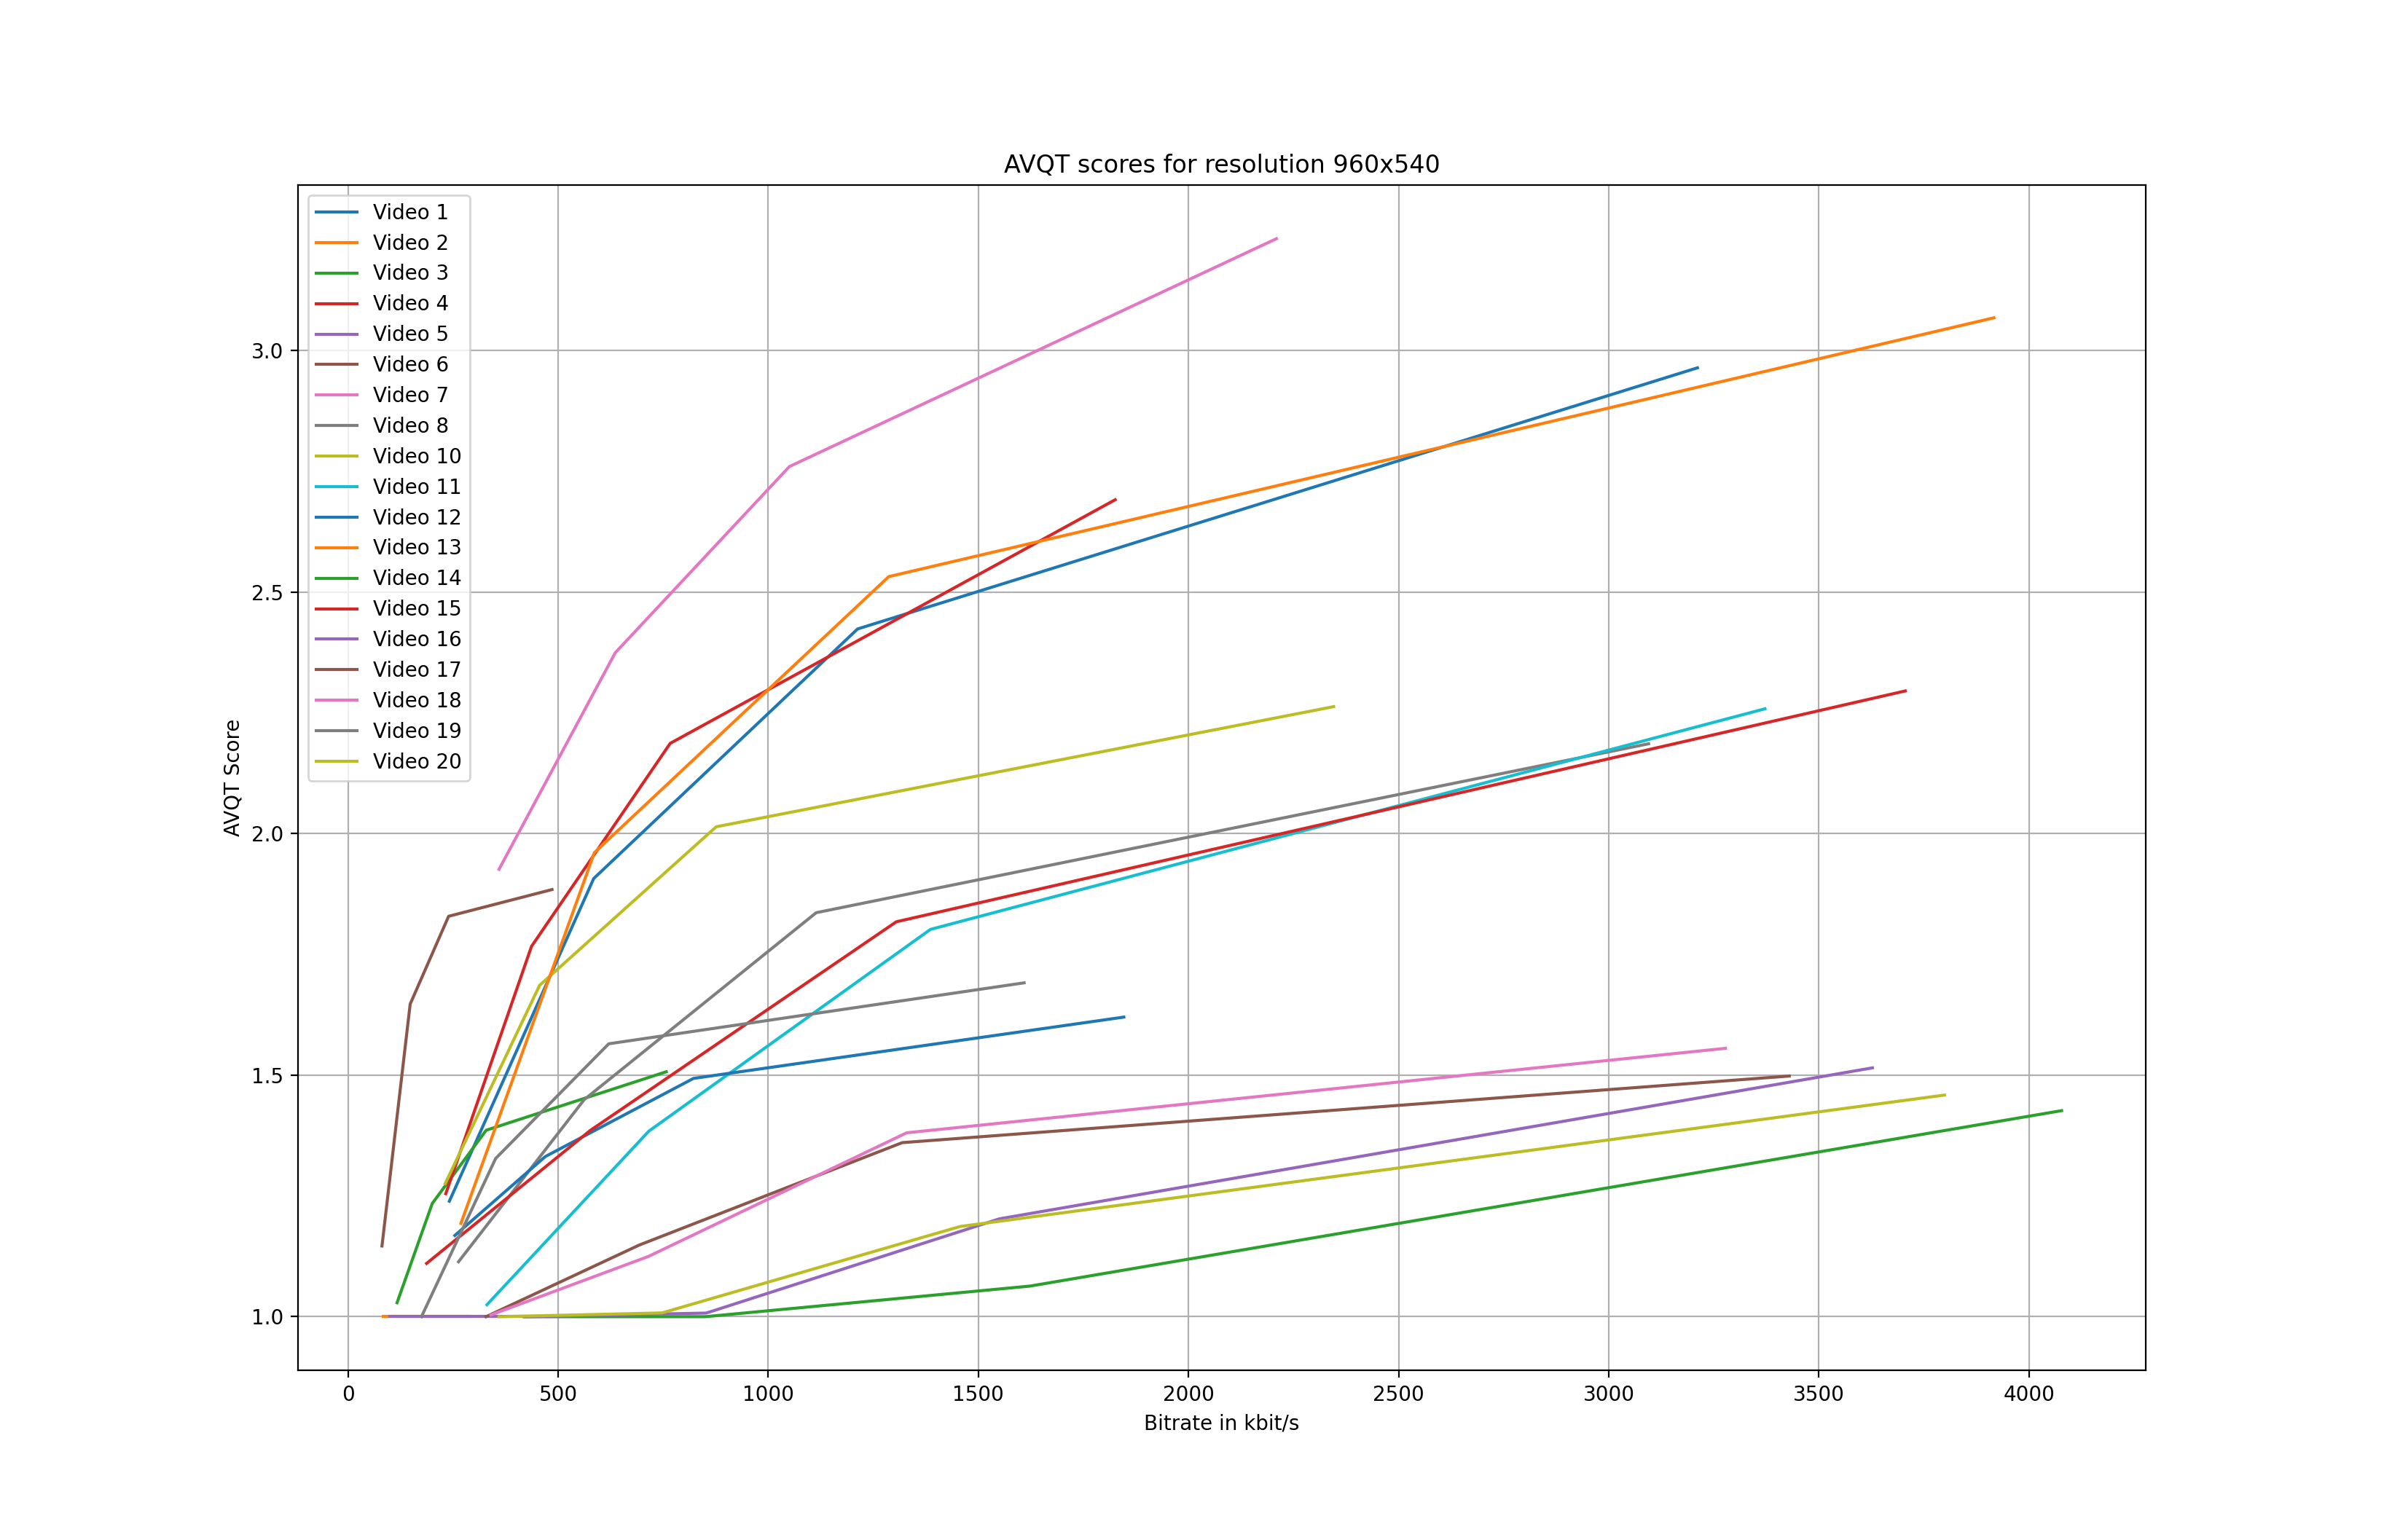
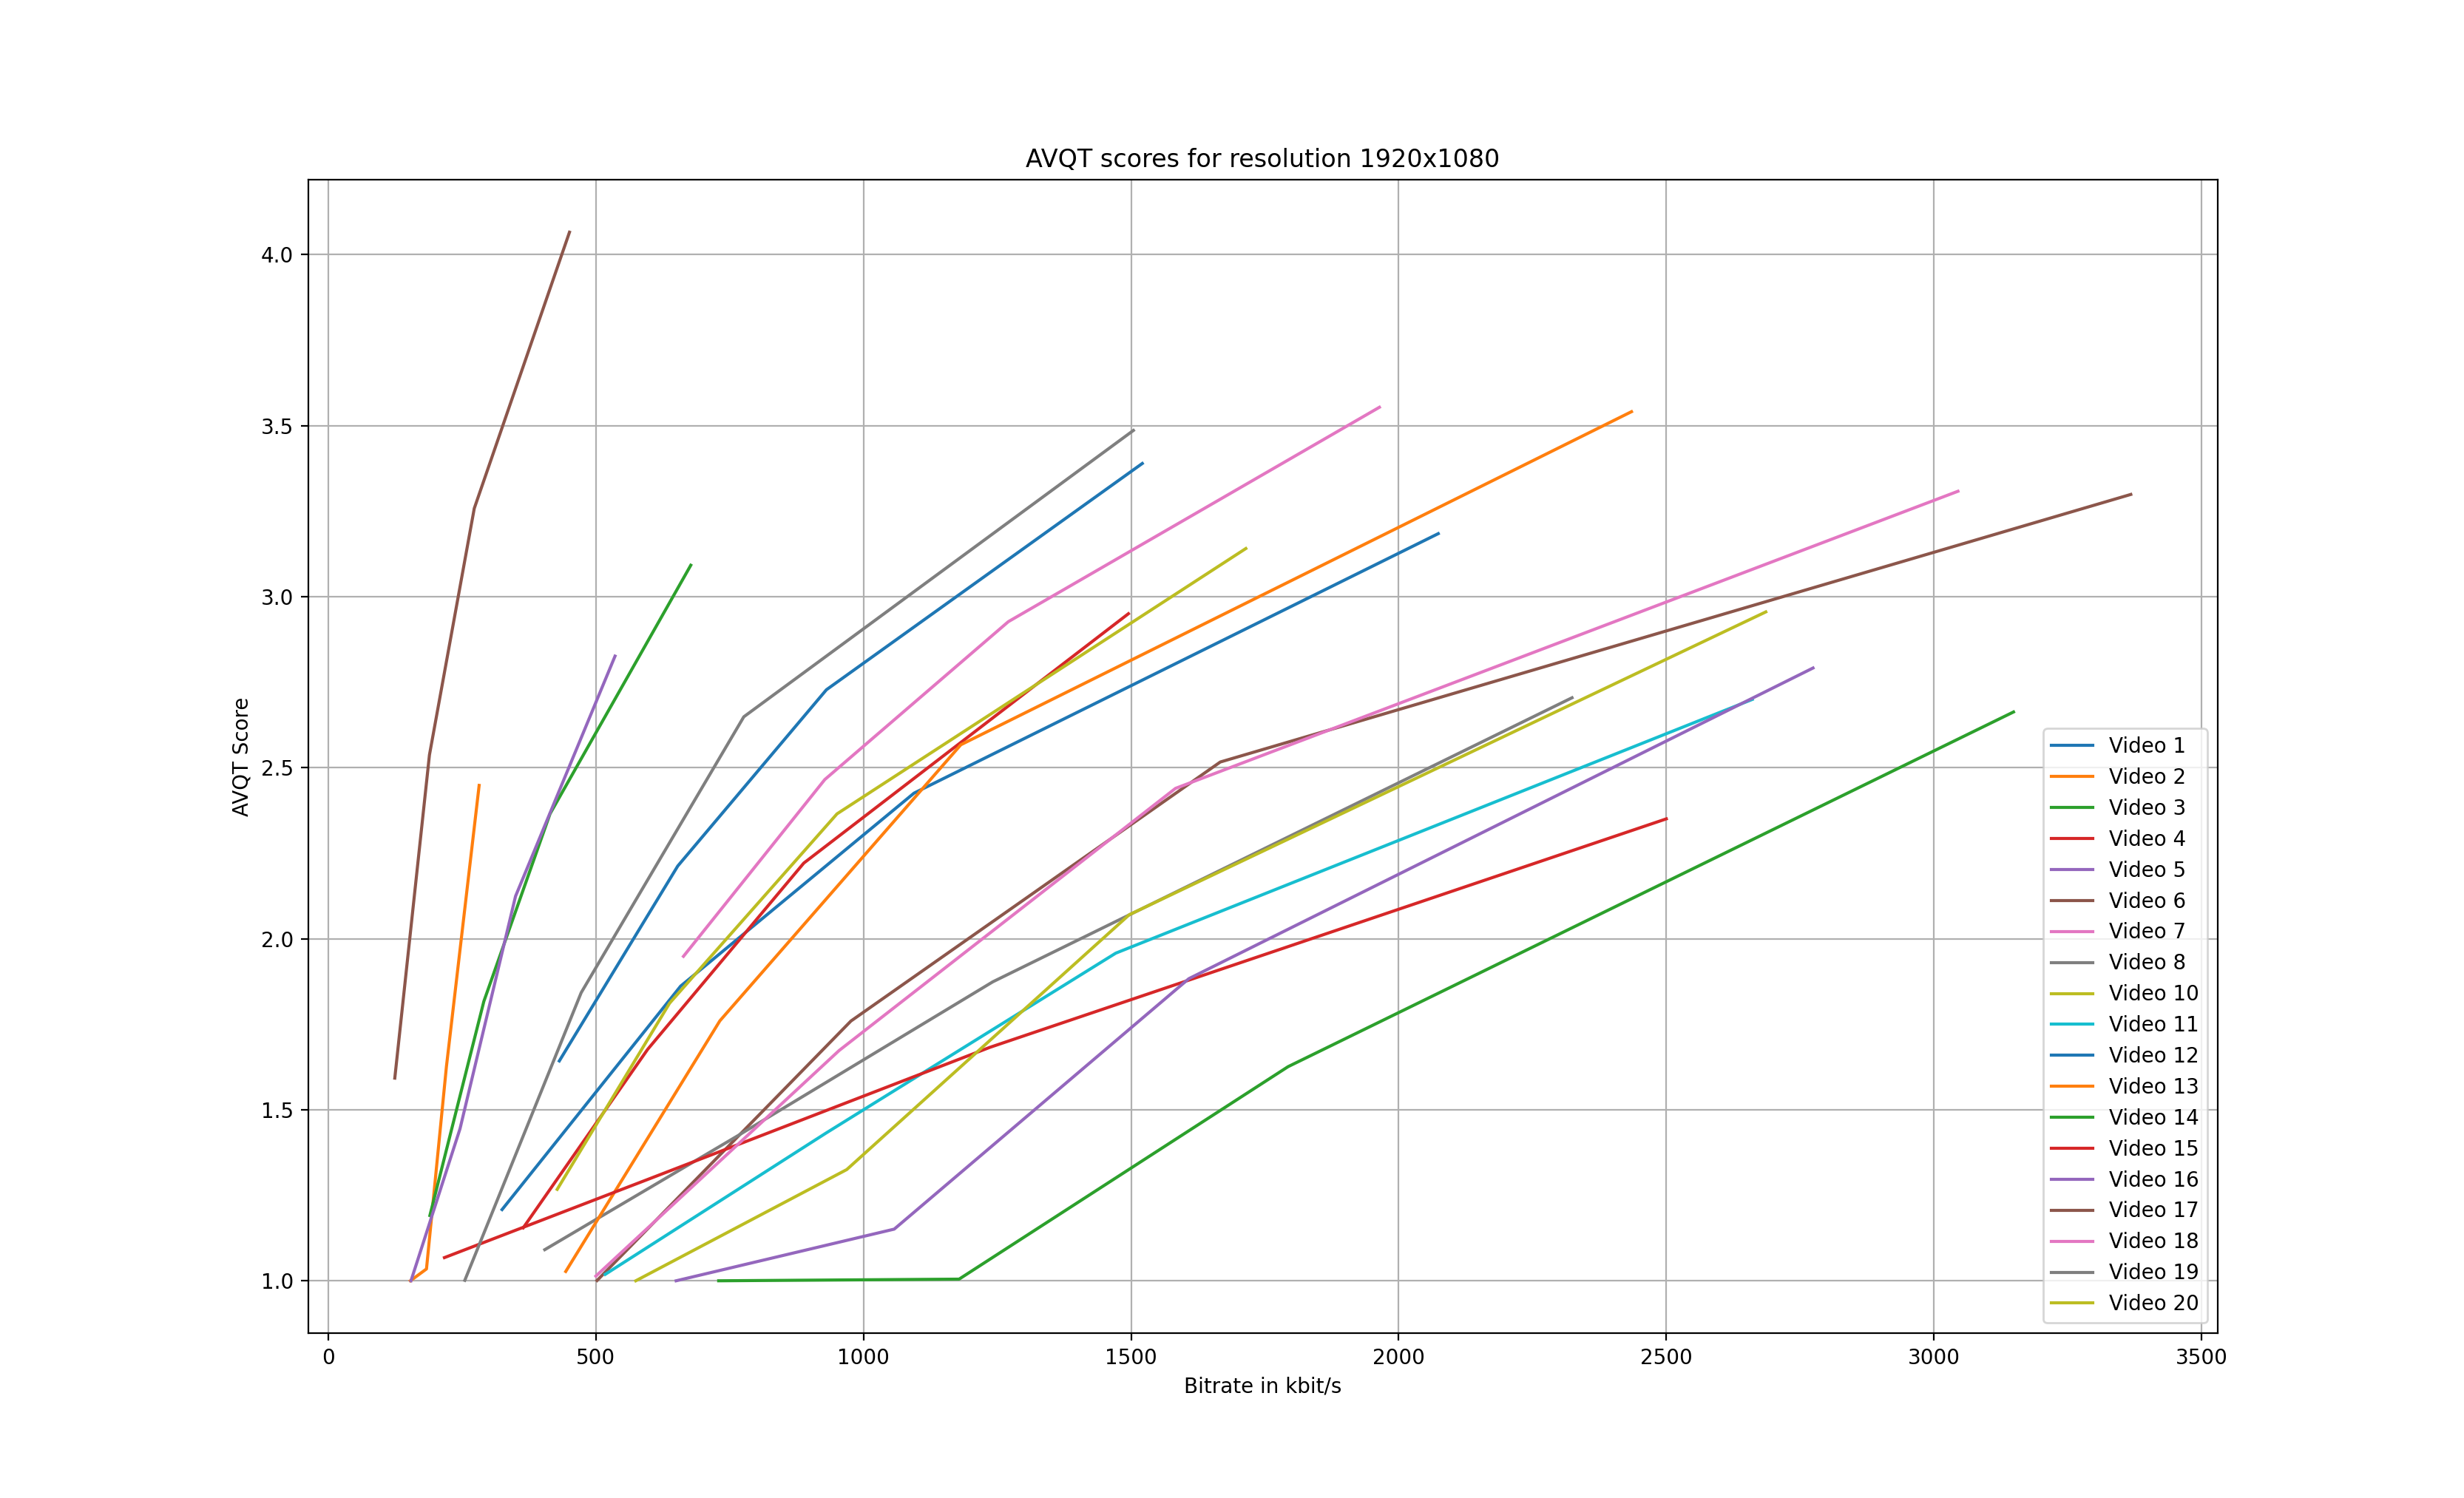
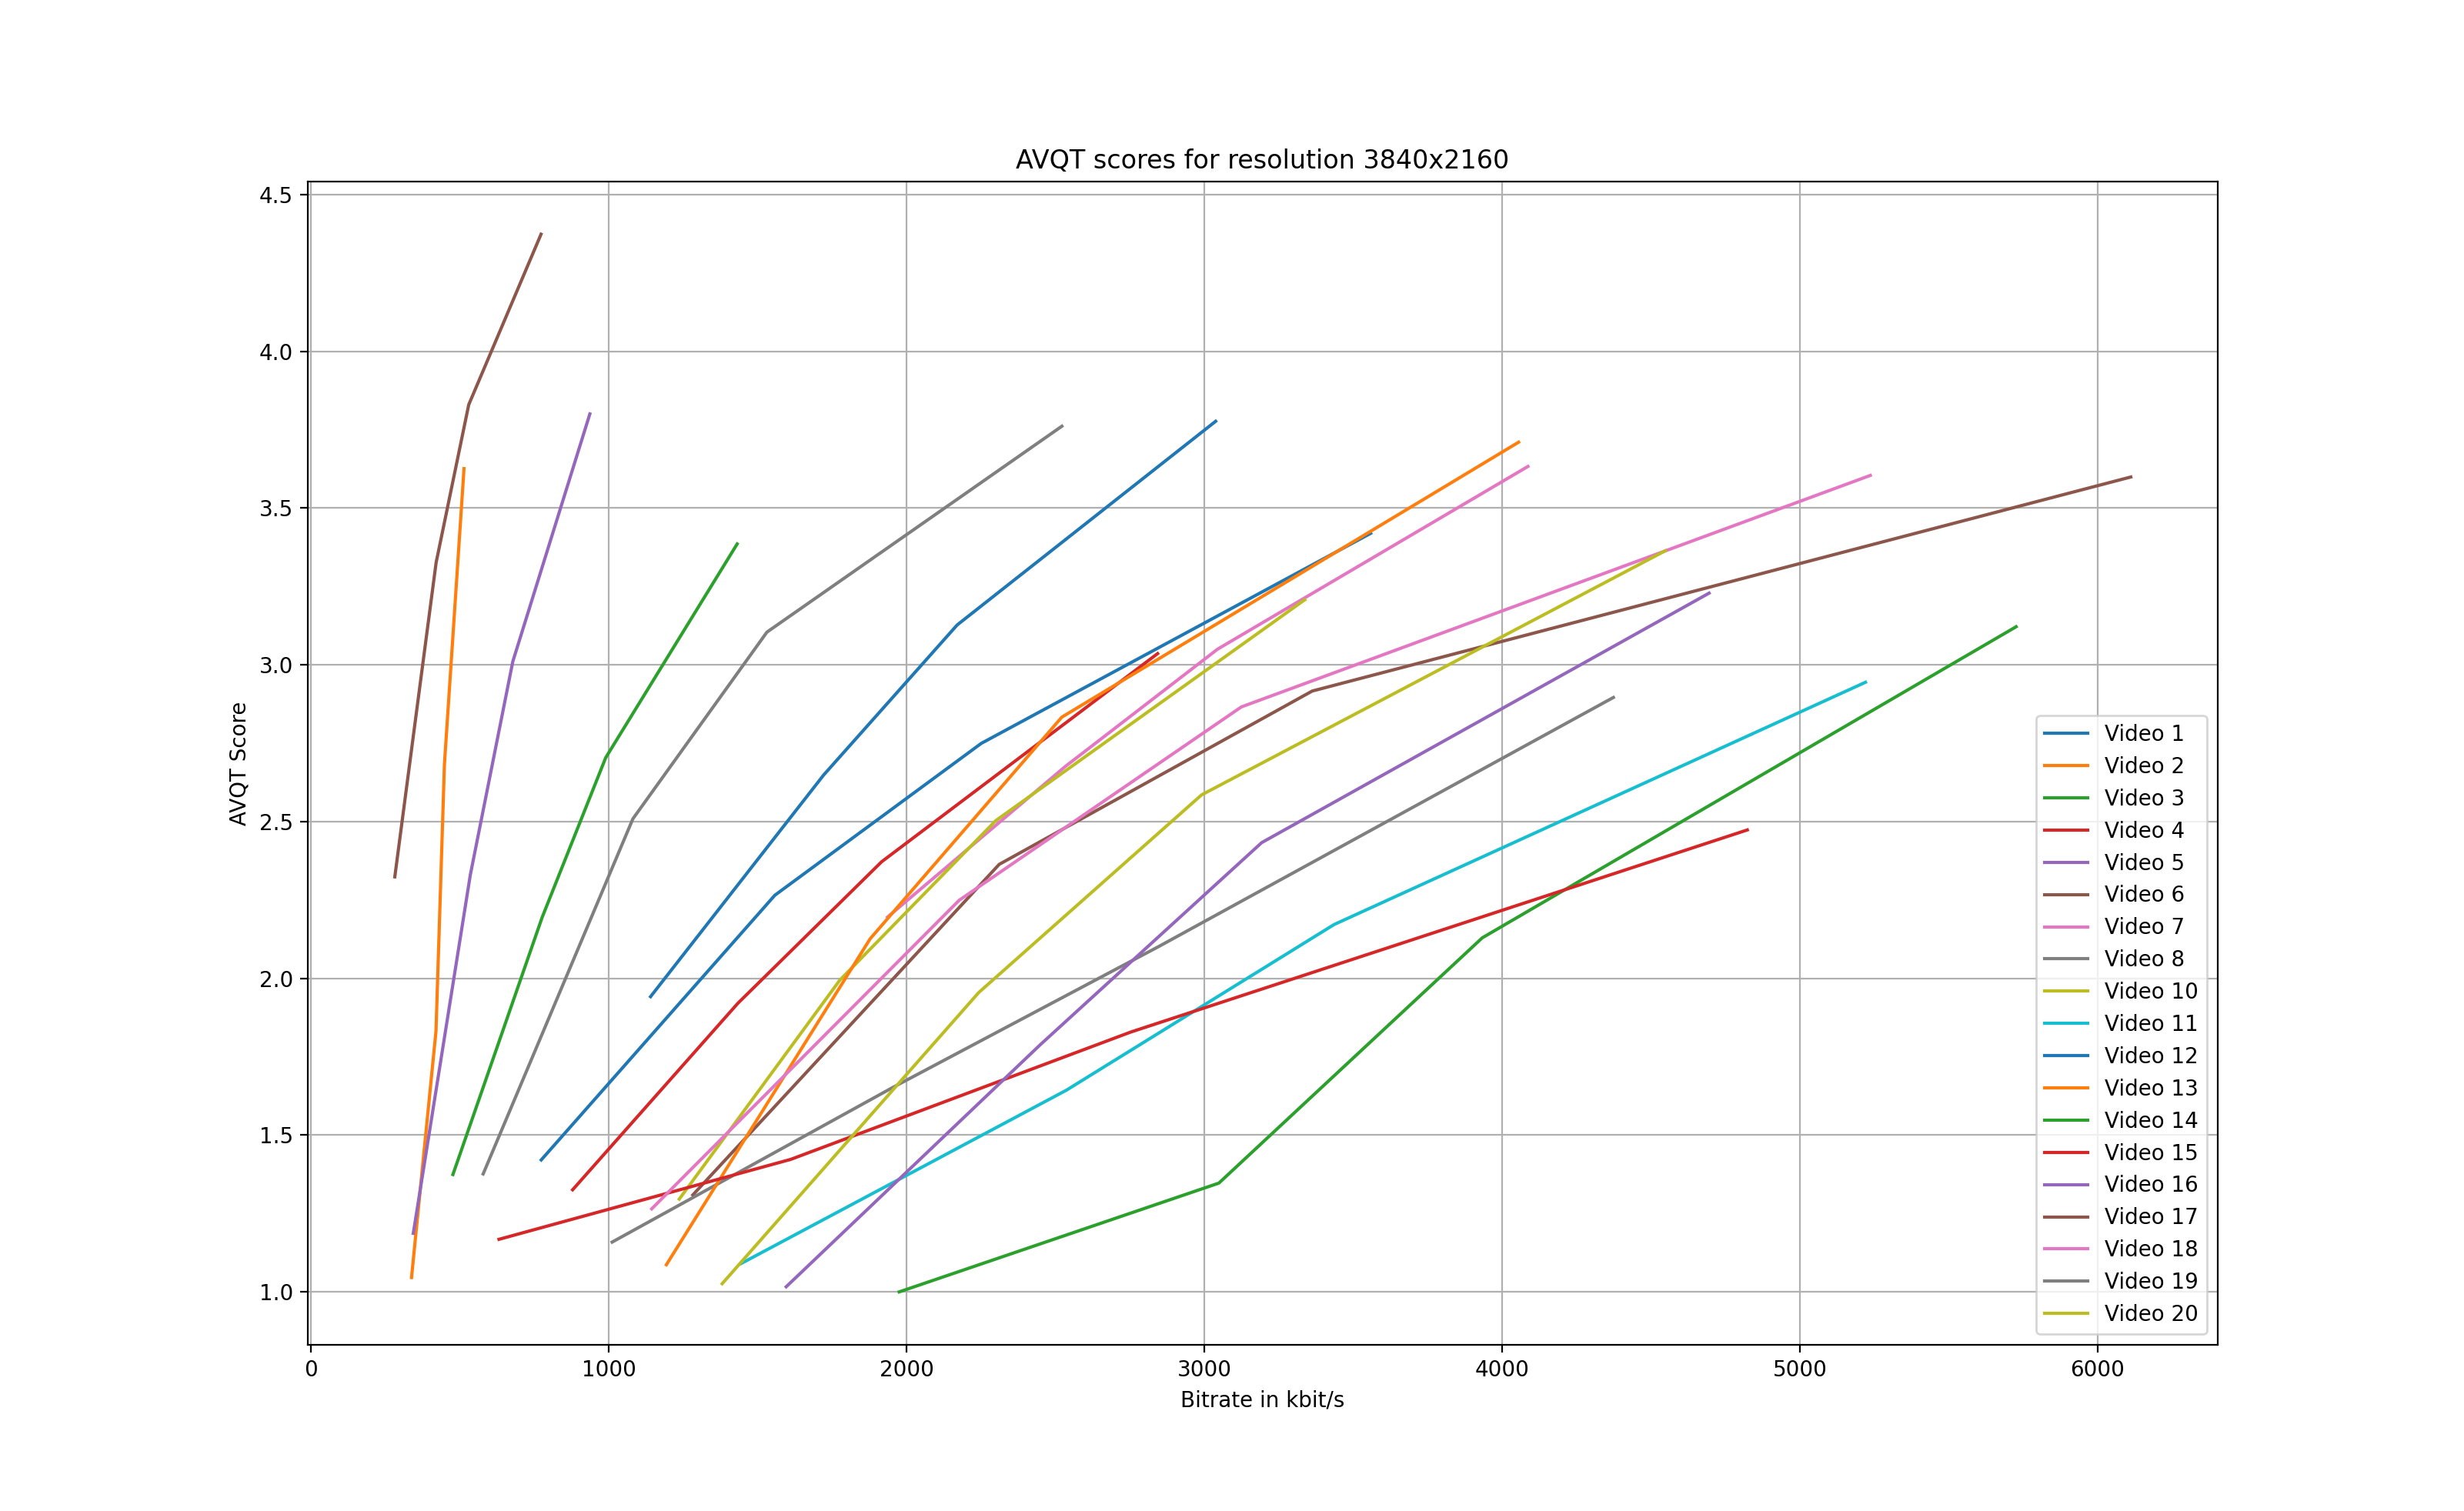
There are a few key takeaways when looking at the graphs:
- First, the results confirm that different types of content require different bitrates in order to achieve similar AVQT scores. Looking at Figure 3, we can see that content 17 (brown line on the farthest left side) requires only 770 kbit/s to achieve a AVQT score of 4.4. On the other hand, content 14 (depicted in green) peaks at an AVQT score of 3.1 having a bitrate of 5800 kbit/s.
- A few of the encodes ended up with a score of exactly 1.0, which does not seem plausible. Taking content 14 as an example, at a bitrate of 1200 kbit/s, the score for the 960×540 encode shows a value larger than 1.0 while the 1920×1080 is exactly at 1.0.
- Finally, the scores for video number 9 could not be calculated, as we ended up with a duration mismatch error: Duration mismatch. Test is 9.967 seconds, Reference is 9.966666666666667 seconds.
Deriving the optimal encoding ladder
Now, how can we use the obtained AVQT values in order to derive a tailored encoding ladder for each of the videos? To do so, let’s first have look at the AVQT scores for a single video:
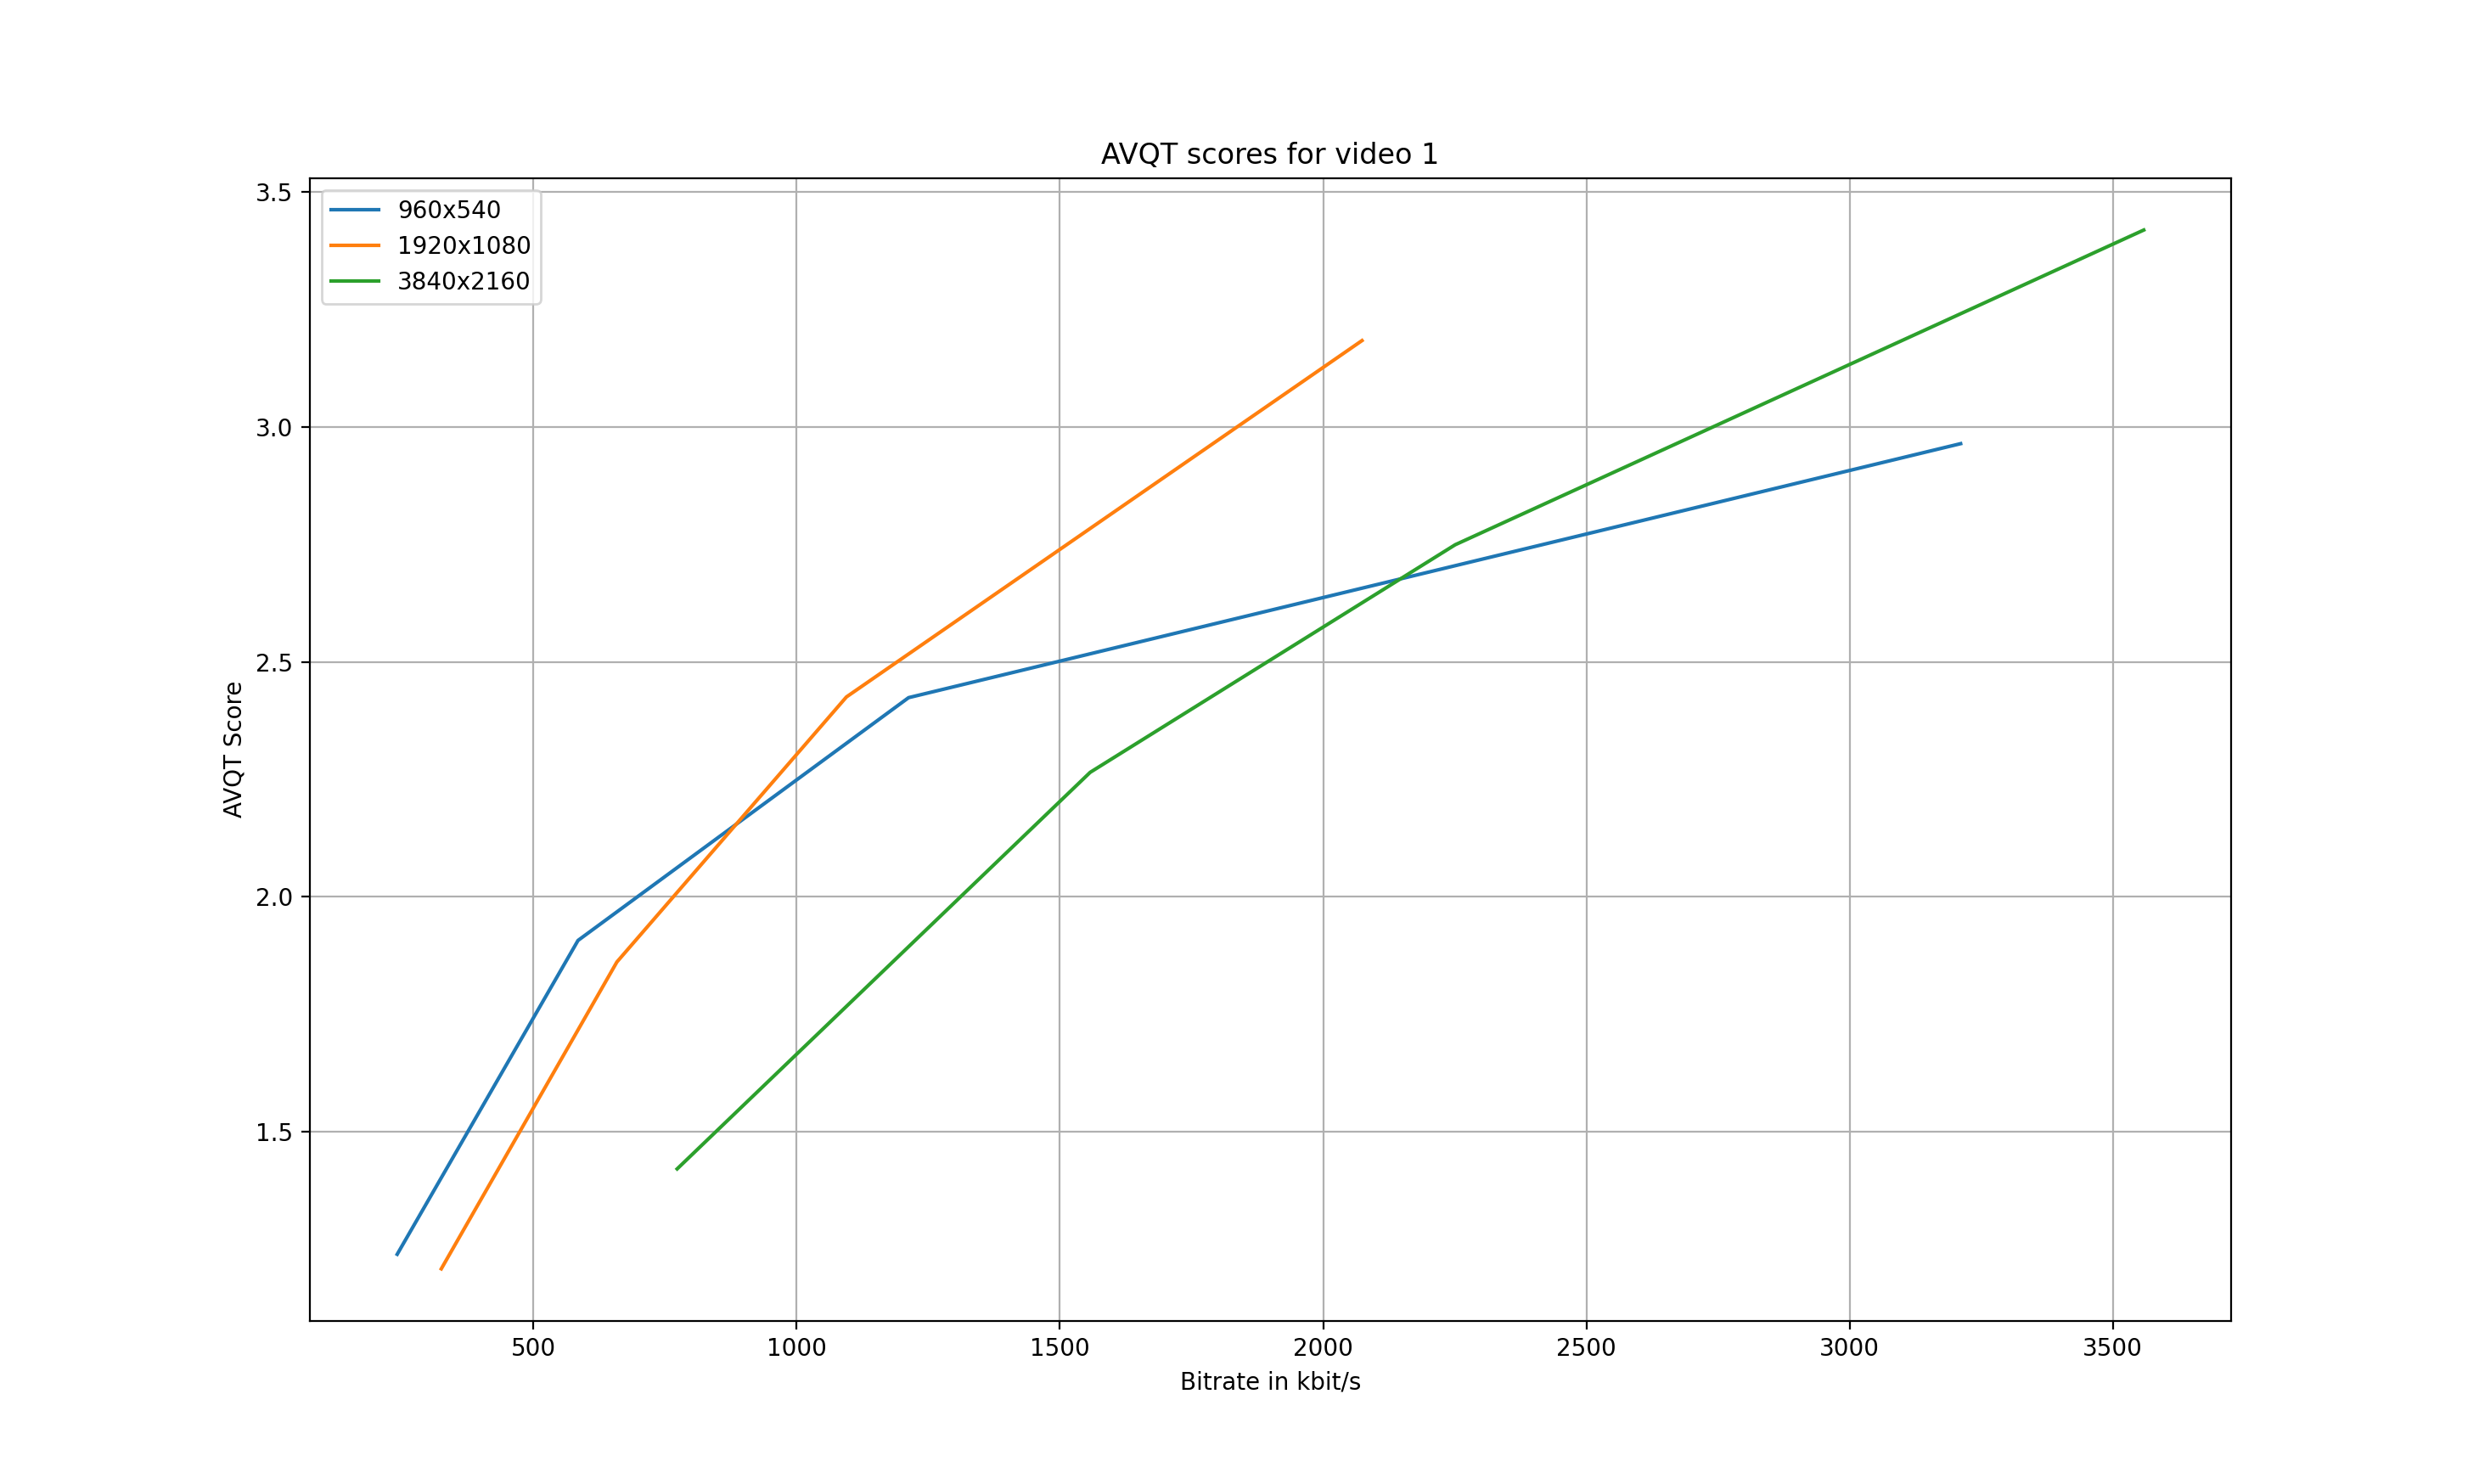
Figure 4 shows the AVQT scores of video 1 for the three available resolutions. The lower resolutions outperform the higher resolutions at low bitrates. As an example, at 500 kbit/s, the 960×540 resolution has a higher AVQT score than the 1920×1080 and 3840×2160 resolution sizes. Starting at approximately 850 kbit/s, however, the 1920×1080 resolution outperforms the other two resolutions, resulting in an AVQT score of 1.7.
As a note, due to the limited amount of data points (only four test encodes for each resolution), we see no intersection of the 1920×1080 and the 3840×2160 curves.
In order to identify the optimal resolution for a specific bitrate, we can simply search for the highest AVQT score at a specific bitrate. For instance, if we want to provide a variant with 2000 kbit/s, we would select the 1920×1080 resolution. On the other hand, if we are aiming for a specific AVQT score like 2.0, we would then select the 960×540 encode at a bitrate of approximately 700 kbit/s.
This leads us the classic and well known “convex hull” approach, as shown in figure 5, in which the optimal bitrate/resolution pairs are situated along the curve, covering our three resolutions:

Problems and challenges
While the general approach of per-title encoding seems to work well with AVQT, there are a few challenges to overcome.
For starters, AVQT is “only” a macOS command line tool. It is not possible to simply set up virtual Linux or Windows machines to calculate AVQT, though running multiple Mac Mini desktop computers may be one solution. AWS also has support for Mac instances in EC2. Consequently, it can not easily be integrated into existing CI/CD per-title encoding pipelines, so suppliers would need to find a workaround solution in order to tackle scalability problems that may arise from this limitation.
Moreover, there are no details available in regards to the concrete implementation of AVQT. In contrast to VMAF, AVQT is not an open-source project. Apple provides some statistical data on AVQT’s performance in terms of correlation (PCC, SROCC) and errors (RMSE) by using popular datasets like the Waterloo IVC 4K Video Quality Database. Still, content providers need to carefully examine whether or not AVQT shows a high correlation between user-perceived quality and their own content as well. While VMAF allows users to plug in a custom-built model, potentially tailored to specific types of content, users can only rely on the built-in model for AVQT.
In addition, Apple only compares AVQT to PSNR and avoids doing any comparisons with VMAF. As VMAF has become very popular over the past few years, providers may be hesitant in moving away from such a well-evaluated metric.
The main question I am asking myself is: what does AVQT provide that metrics like VMAF do not? A faster computation time may be one major advantage, but that has to be further evaluated. And in the long-run, AVQT can potentially run alongside metrics like VMAF (leaving aside the aforementioned scalability and platform problems). Once providers have gained enough experience and reliable data, they might be confident enough in using AVQT as the main metric for their encoding ladder decisions.
Summary
In this blog post, we looked at Apple’s new perceptual video quality metric named AVQT. We tested the tool by applying the metric to the popular Waterloo IVC 4K Video Quality Database. Based on the resulting AVQT scores, we were able to confirm that different types of content require different bitrates in order to achieve a similar quality. We looked at an easy way to derive the optimal encoding settings for a video by using the AVQT scores to calculate a convex hull. Finally, we talked about potential problems and challenges AVQT users have to overcome, such as the lack of support outside of macOS systems and missing implementation details.
In one of our next blog posts, we will examine how the AVQT scores compare to VMAF scores and how both metrics correlate. In the meantime, if you have any questions on per-title encoding and how to derive the optimal encoding settings using a time-saving, machine learning-based approach, check out our activities in the Deep Encode project.
Bibliography
[1] Evaluate videos with the Advanced Video Quality Tool – https://developer.apple.com/videos/play/wwdc2021/10145/
[2] Waterloo IVC 4K Video Quality Database – http://ivc.uwaterloo.ca/database/4KVQA.html
Arijit Biswas says:
From where can I download the AVQT?
Looking for a Linux version.
Daniel Silhavy says:
There is no Linux version afaik. It is available for MAC only and you need an Apple Developer account. The download link can be found here: https://developer.apple.com/videos/play/wwdc2021/10145/