
In times of Corona not only are big conventions shifting to online meetings but Fraunhofer FOKUS (and many other companies,) have transitioned their regular town hall meetings to virtual settings as well. In this blog post we will explain how we streamed the virtual meeting and the presentation to Fraunhofer FOKUS employees. Moreover, we will share some interesting streaming metrics and results that were collected with our FAMIUM SAND Streaming Analytics solution.
In case you are are asking yourself: why didn’t they just use one of the dozens of webinar / conferencing solutions out there: because we can ? and because we used the event to experiment with some of the latest implementations we did with the dash.js player.
The technical setup
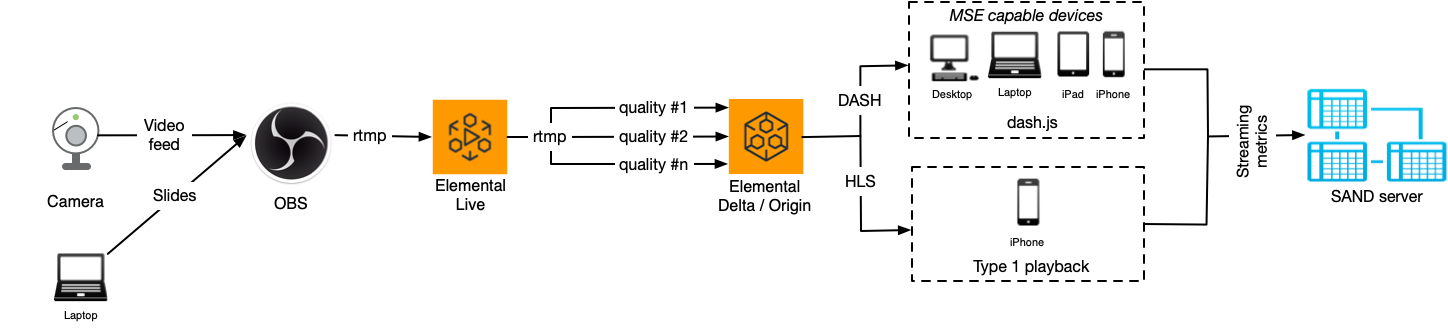
Let’s first take a look at the complete streaming chain first and then dig deeper into its specific parts. Figure 1 illustrates how the video signal is captured, encoded, packaged and then delivered and played on an end user´s device.
Capturing the source
When streaming an online presentation, it is always helpful to see both the presenter and his/her presentation slides simultaneously. Therefore, both video signals, one coming from the camera, and the other one coming from the presentation laptop, must be combined. In order to do that, we decided to use OBS Studio Software (OBS) which is open source and free of charge. As a result, the output of OBS was an H.264 encoded RTMP stream with a resolution of 1920×1080, at a bitrate of 9Mbit/s with 50 frames per second.
Encoding and packaging
For transcoding and packaging, we decided to use Elemental Live and Elemental Delta, respectively. We defined six different video qualities, each encoded at 25 frames per second. H.264 was exclusively used to ensure support on all possible end devices and platforms. For future events, we will add video codecs such as VP9 and H.265, as both promise better compression rates than H.264. For our current solution, the following encoding ladder resulted as such:
| Resolution | Bitrate kbit/s |
| 352×198 | 270 |
| 640×360 | 400 |
| 640×360 | 800 |
| 960×540 | 1200 |
| 1280×720 | 2000 |
| 1280×720 | 3100 |
Prior to the live event, we performed some testruns in order to identify the optimal encoding settings. Using our Deep Encode solution we discovered that delivering the stream at 720p with 3.1 Mbit/s results in a very good VMAF score of 93. This is why we chose to omit the 1080p resolutions and cap the maximum bitrate at 3.1 Mbit/s. Also, we selected certain encoding ladder rungs in a way that the quality values are at least one JND (equals 6 VMAF points) apart from each other.
The outputs of the Elemental Live encoder are six RTMP streams for video (corresponding to the encoding ladder above) and 1 RTMP stream for audio, all of which are then fed into the Elemental Delta packager.
The Elemental Delta packager creates two streams: MPEG-DASH and HLS. The manifest and media segments are also stored on the Elemental Delta, which serves as an origin.
Playback on the client
One of the major challenges when streaming to a wider audience is the heterogeneity of end devices. Since our stream was only accessible via VPN, we did not have to apply DRM protection. The stream was offered via a webpage, where we included a capability check for the Media Source Extensions (MSE). All devices that support MSE used dash.js for the MPEG-DASH stream playback. On iPhones, which do not offer MSE support, we used the native Type-1 HLS playback.
FAMIUM SAND Streaming Analytics
In order to receive reliable feedback about the quality of our stream and the quality of experience for our viewers we integrated our FAMIUM SAND Streaming Analytics solution.
FAMIUM SAND is a real-time metric reporting tool that monitors player performance information like average throughput, buffer level, representation switch events and many more.
FAMIUM SAND tightly integrates with all major MPEG-DASH and HLS players like dash.js, Shaka player, hls.js and Exoplayer.
Network utilization
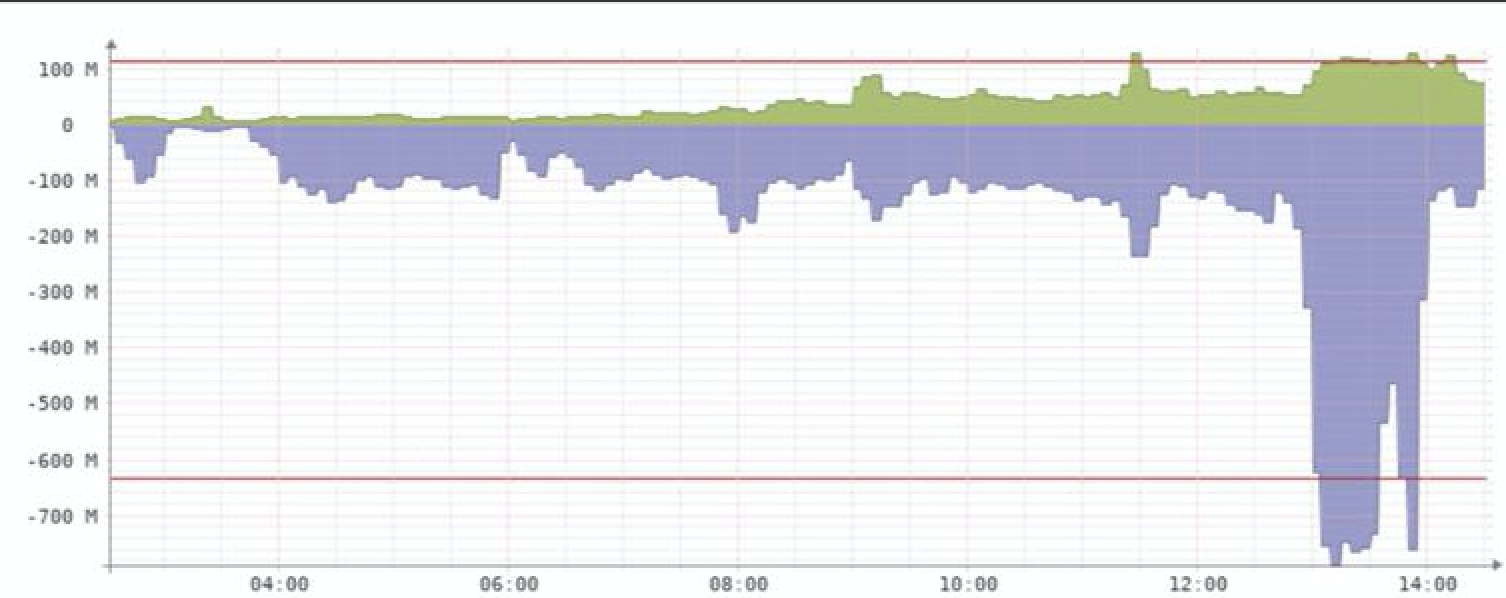
In order to understand the results of the collected streaming metrics it is important to identify the limitations of the underlying network connection. Figure 2 illustrates the network utilization during the event. We can identify a spike between 12:45 and 14:00 which happened to coincide with the townhall meeting. In order to not oversaturate the available resources we limited the downlink to 1Gbit per second.
Analyzing a single streaming session
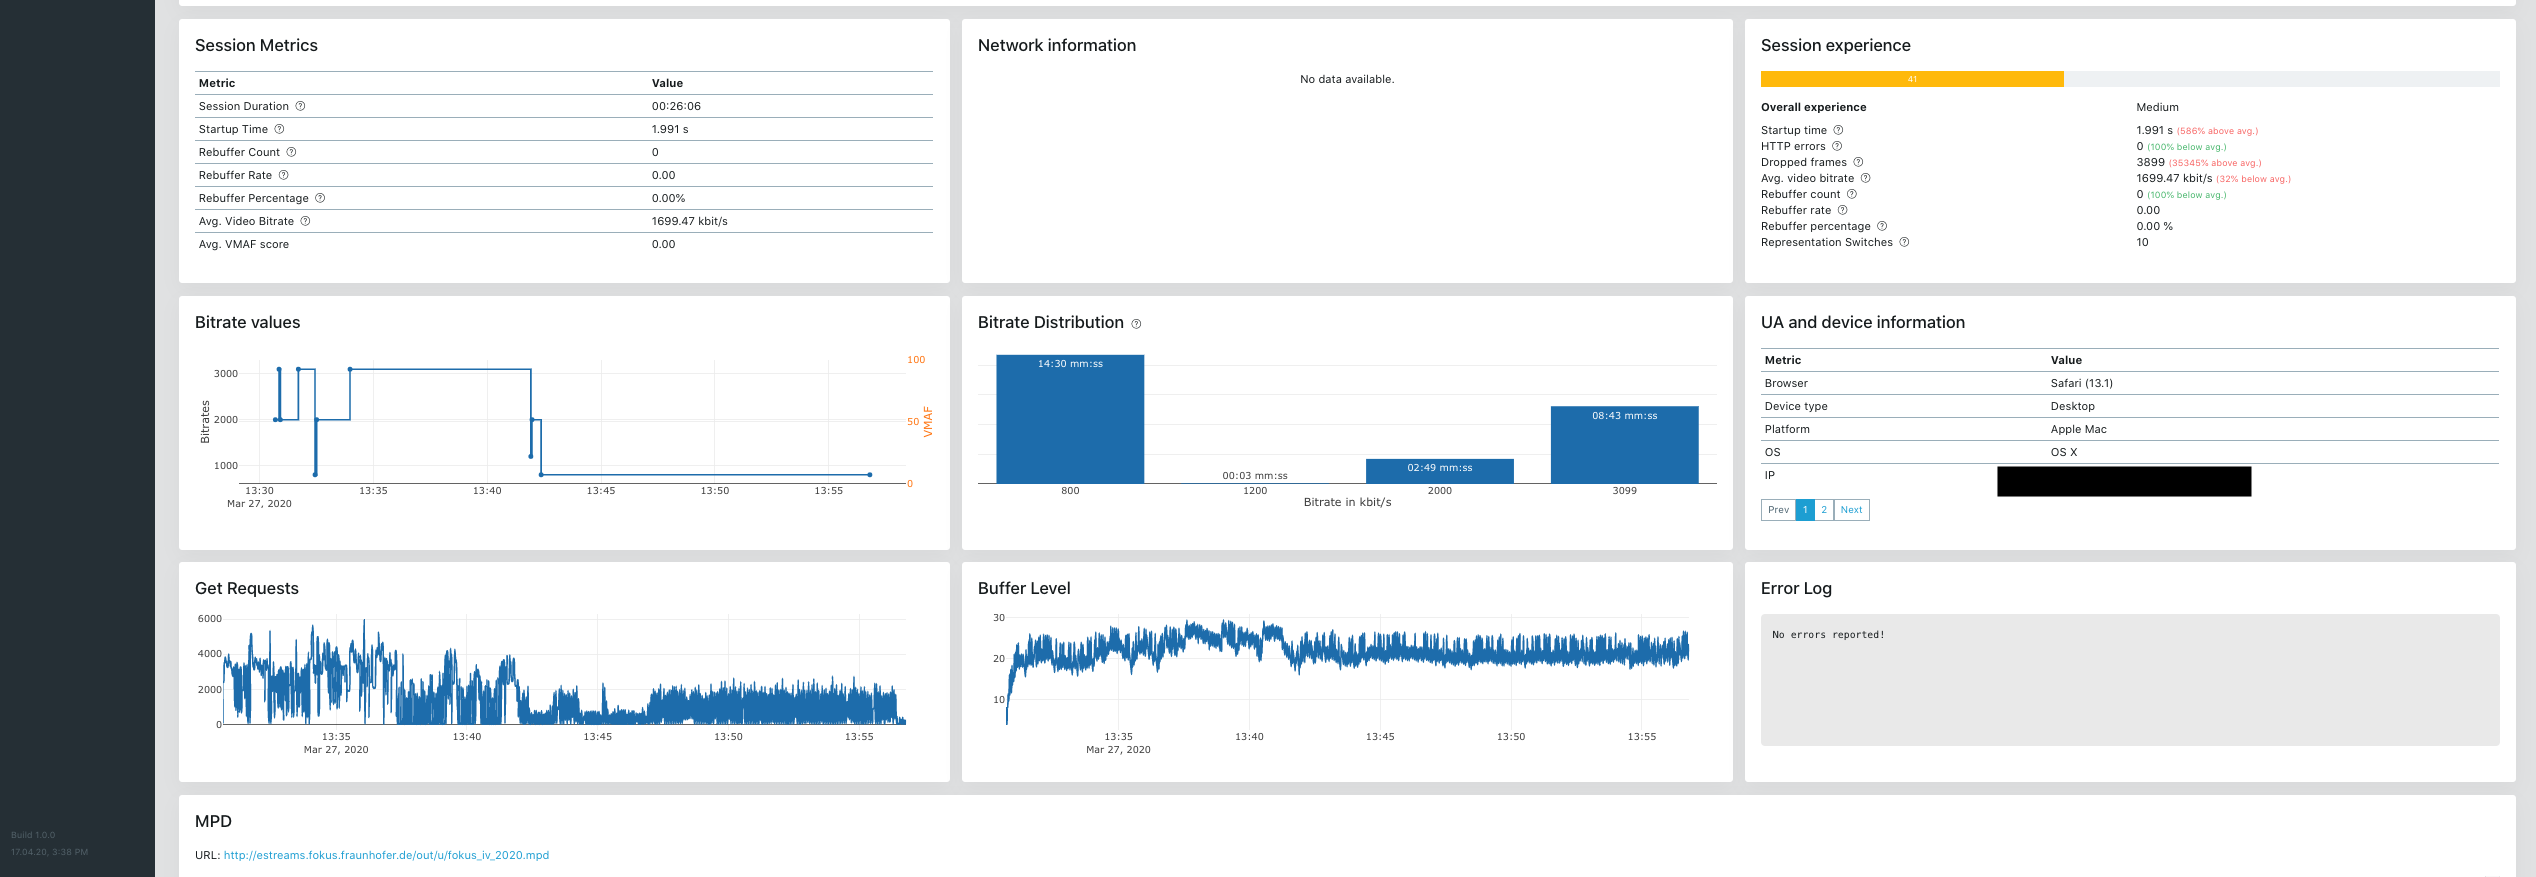
Figure 3 illustrates a single streaming session monitored with FAMIUM SAND. In this example, the streaming session ran for 26:06 minutes in a Safari browser on a Mac OS X Desktop device.
We can identify ten representation switches that occurred mainly during the startup phase and at the end of the streaming session. The client played on 800 kbit/s and 3100 kbit/s for the majority of the time (14:30 and 08:43 minutes, respectively), which leads to an average video bitrate of 1700 kbit/s.
The overall session experience ranges from 0 to 100, and is derived by combining and weighting all available metric values. A score of 100 indicates an optimal streaming experience.
In our example, the low score of 41 was mainly caused by the high number of dropped frames, high startup times and low average bitrates.
Accumulating the results
Next we take a deeper look at the accumulated results of the FAMIUM SAND streaming analysis to evaluate the overall streaming experience.
Sessions over time
Figure 2 shows how the number of unique streaming sessions progresses over time.
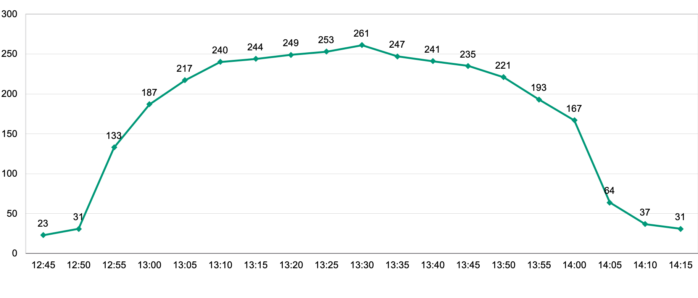
At peak time, we had 261 parallel sessions with an average streaming time of 47 minutes. In total, 534 streaming sessions were initiated and 278 unique clients were watching. A majority of the users watched the stream on a Desktop device using Chrome or Firefox.
Bitrate distribution
Figure 3 illustrates the bitrate distribution by percentage.
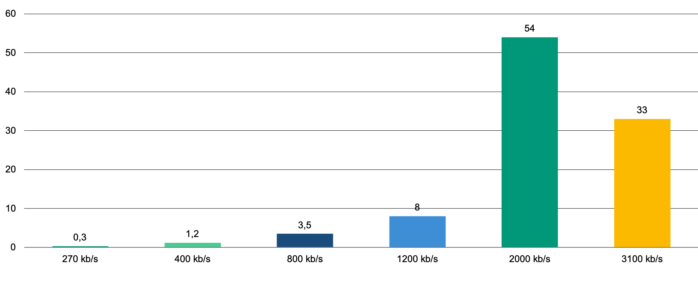
The majority of 87% of the clients played at the two highest bitrates. Only 1.5% of the devices encountered performance issues or ABR problems and switched to the two lowest bitrates.
Performance metrics
Table 2 shows performance specific metrics
| Average | Minimum | Maximum | |
| Session Duration | 00:47:12 | / | / |
| Video Bitrate | 2330 kbit/s | / | / |
| Startup Time | 1.92 sec | 0.013 sec | 23.78 sec |
| Number of dropped frames | 44 | 0 | 3945 |
| Representation Switches | 5 | 1 | 39 |
The average startup time of 1.92 seconds can be improved. For that reason, clients with lower bandwidths should begin playback with a lower quality in order to guarantee a faster startup time.
Moreover, the high number of 44 dropped frames (in average) may be an indicator of rendering problems on certain platforms or browsers. This needs to be investigated further.
The low number of five average representation switches during an average session duration of 47:12 minutes indicates a good streaming experience for most of the viewers. This is supported by the fact that the clients used an average of 2.3 Mbit/s, which, according to the tests we made prior to the event, results in VMAF scores between 80-93.
Learnings and Conclusion
Our virtual town hall meeting gave us an opportunity to set up a complete media streaming chain – from capturing the media feed, to encoding, packaging, media playback and QoE analysis. We obtained valuable data and gained several insights, which helps us in improving our existing solutions and identifying potential problems on specific devices and platforms.
The main takeaways are:
- Adaptive bitrate streaming is crucial when it comes to delivering videos in a network environment with limited capacities. Without ABR streaming the clients interfere with each other and aggressive pre-buffering on multiple clients leads to buffer underruns on other clients.
- Using our Deep Encode solution we were able to derive a customized encoding ladder offering a good compromise between bitrate and quality. We made sure that the rungs in the encoding ladder are at least one JND (6 VMAF points) apart from each other. As a result, we were able to deliver a very good video quality between 80-93 VMAF points at bitrates between 2.0Mbit/s to 3.1 MBit/s to 87% of our viewers.
- Using our FAMIUM SAND solution, we gained some valuable insights into the quality of experience for our viewers. An important finding was that there was a high number of Desktop devices using Chrome and Firefox browsers. This discovery lead to the decision in adding VP9 as a video codec in one of the next events in order to reduce the storage and bandwidth requirements.
- Sophisticated testing helps minimize user complaints. During our tests, we encountered problems with the rendering of our website on specific Android devices. These problems can be resolved prior to the event.
- In some cases where the network was fully utilized, classic ABR algorithms showed wild oscillations between quality levels and resulted in bad fairness among the clients. We did not see such occurrences during the event, but it is worth keeping an eye on that in the future, since we expect the number of viewers to grow. We covered the topic of fairness for media streaming clients in one our latest blog posts as well.
If you have any additional question regarding our DASH activities or dash.js in particular, feel free to check out our website.
Acknowledgments
I would like to thank everyone involved in this project, especially Robert Seeliger, Frank Burkhardt, Stefan Pham, Christoph Müller, Santosh Mathur and the VST team.