
FAMIUM SAND is an analytics tool for content providers to monitor the performance of their streaming services. In this blog post, we continue to explore SAND’s debugging capabilities using two more concrete examples. For our first example check out Part 1.
3 Ways to Locate Streaming Errors and Understand What Caused Them (continued)
2. Start with the Real-Time Monitoring Dashboard
In the previous section we demonstrated how the Errors Overview dashboard can be used as a starting point for debugging errors. Another good starting point is the Real-Time Monitoring dashboard as we will show in this section.
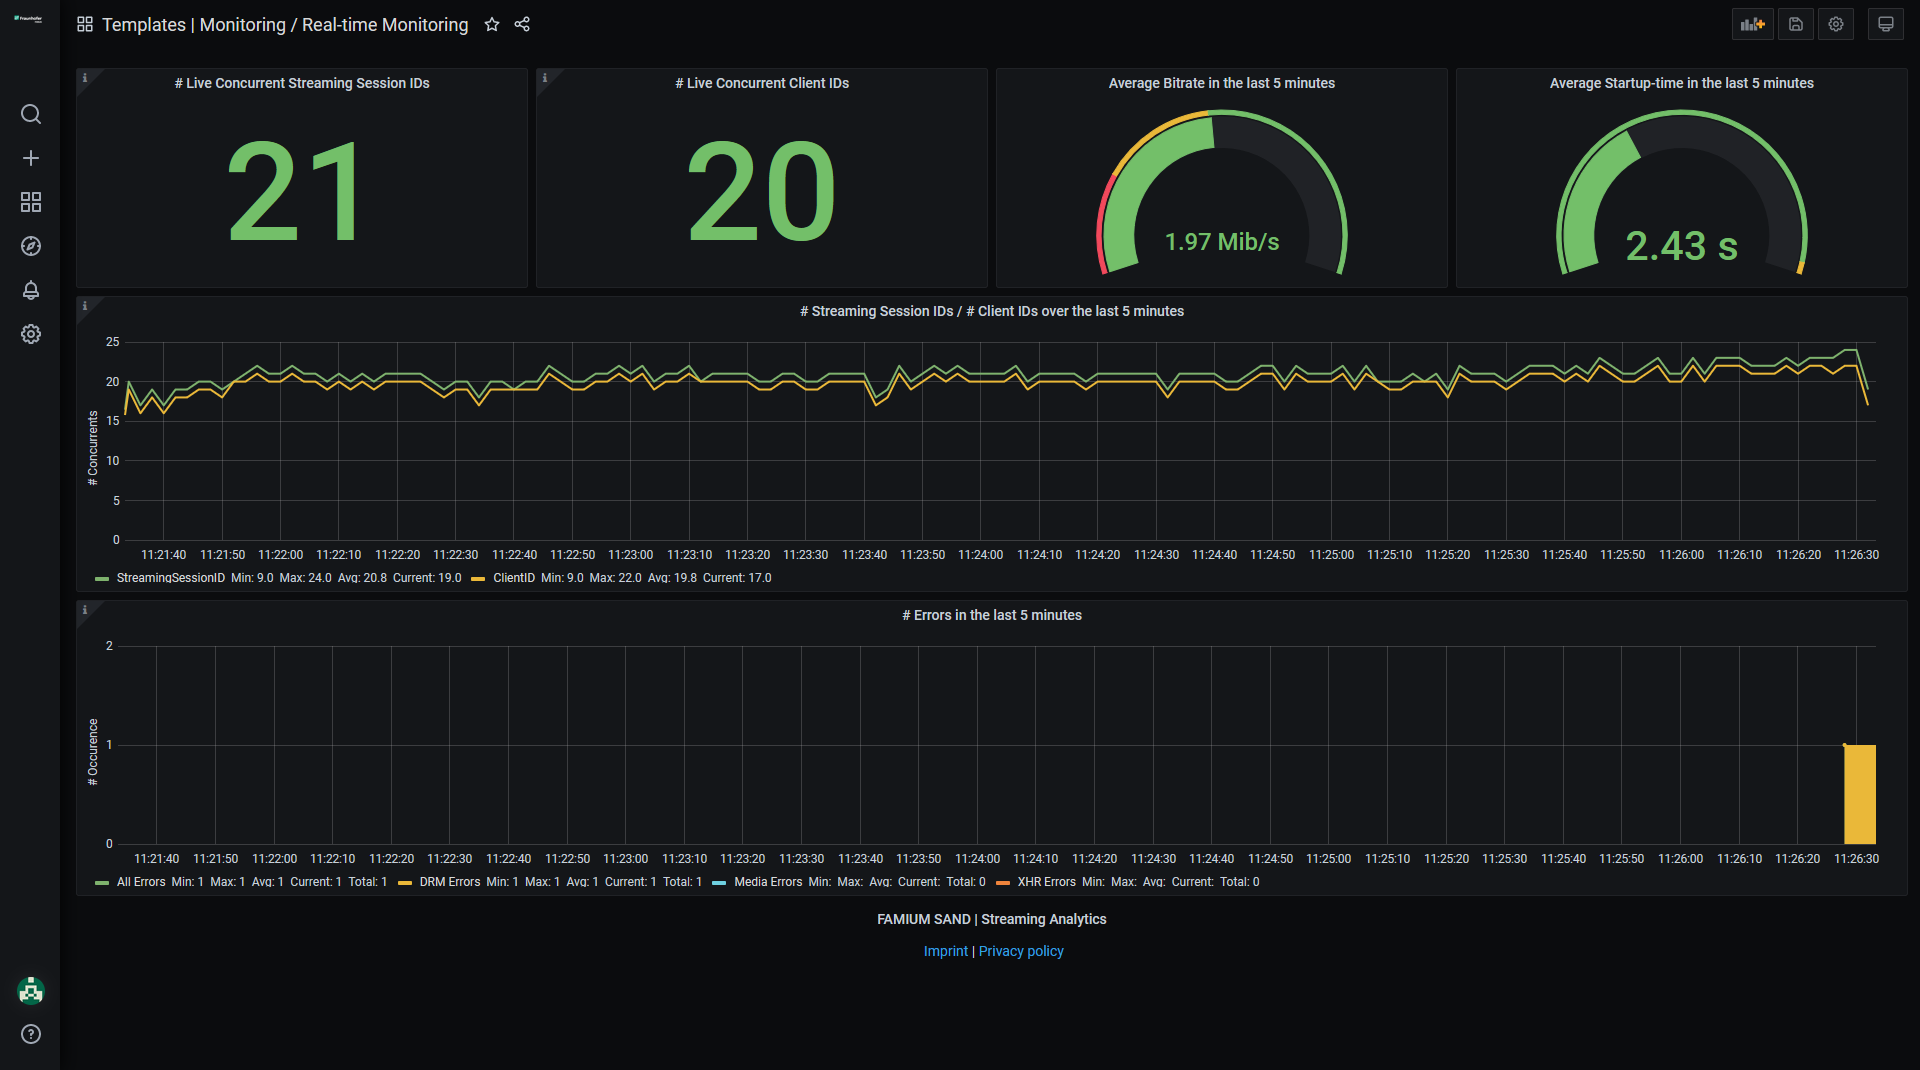
The Real-time Monitoring dashboard is for the live tracking of streaming session performance. Every once in a while, the error graph in this dashboard shows errors just as they are occurring. If it is a serious error, such as a DRM error, it’s probably worth checking out.
Because the DRM error spotted in the Monitoring dashboard has happened in the very recent past, a good dashboard to use for further investigation is the DRM table dashboard. If we sort the timestamp column in ascending order, we quickly find the error.
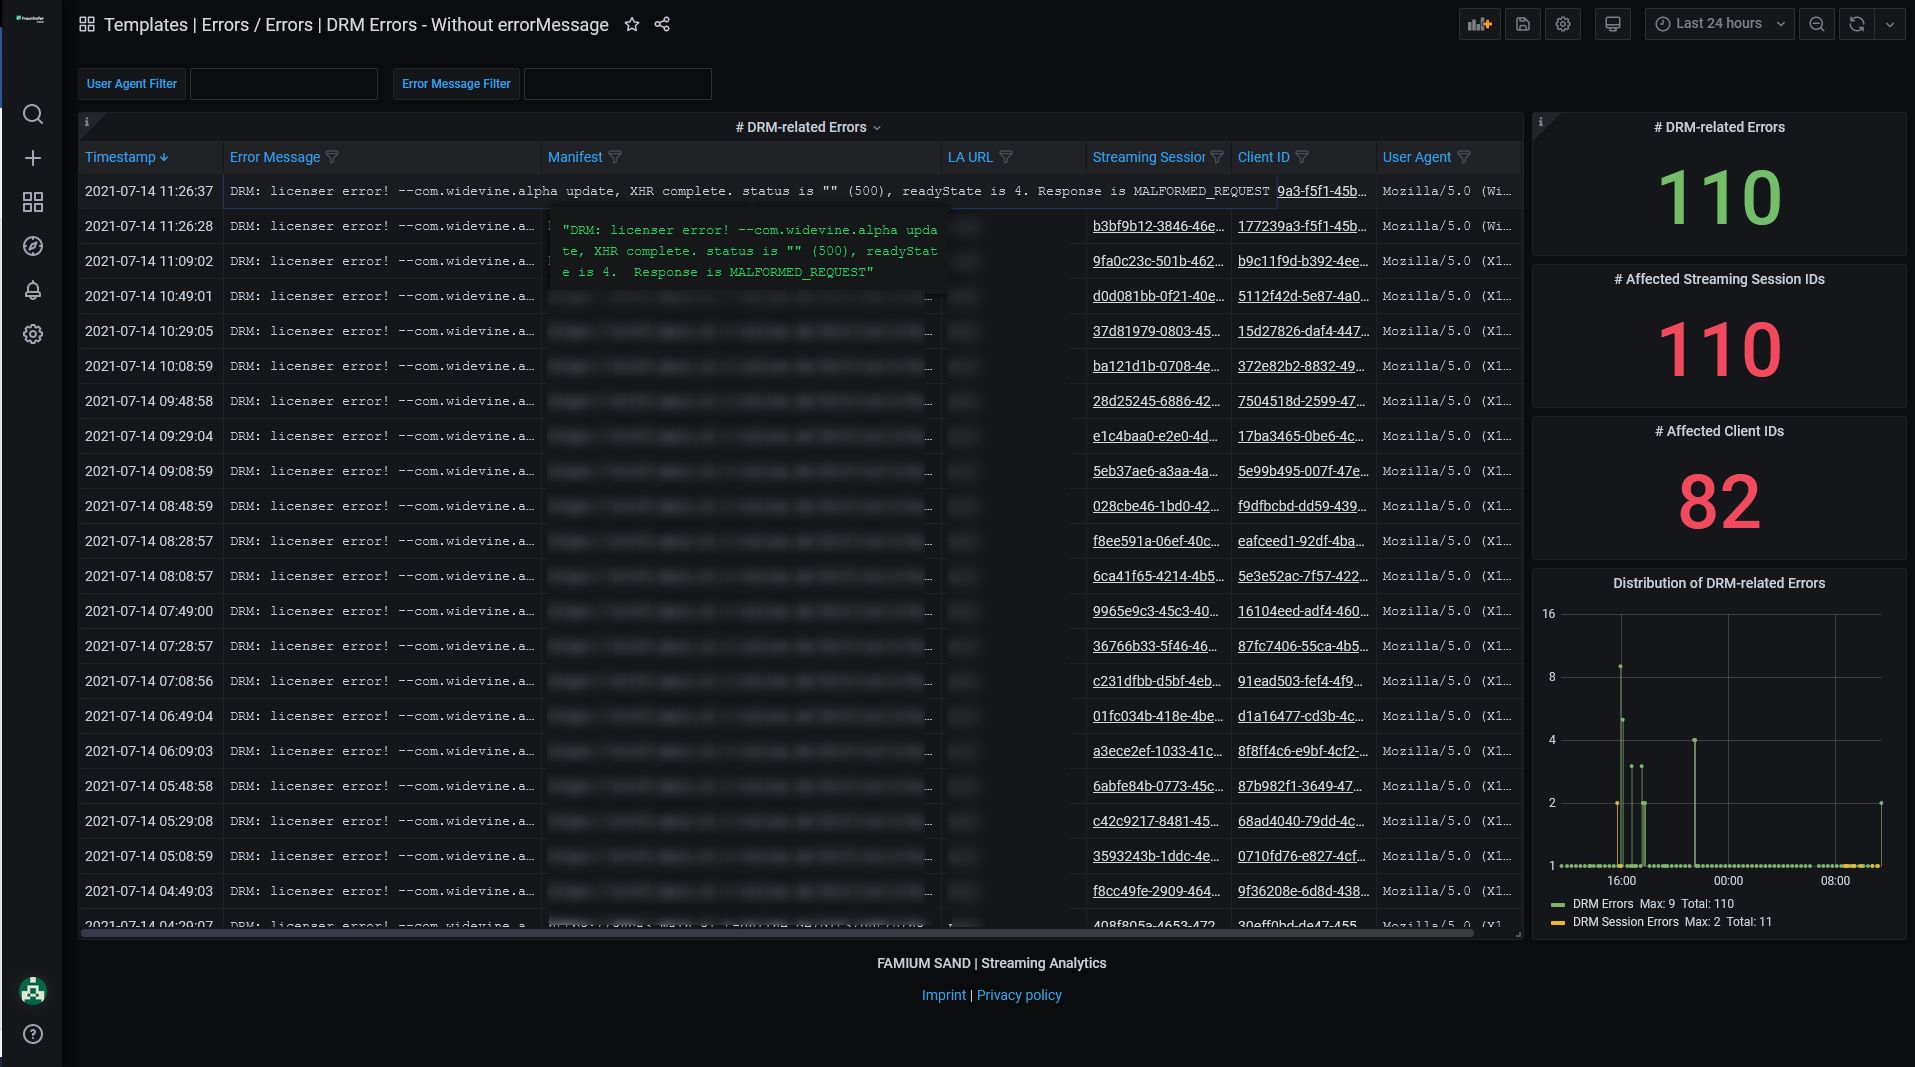
From the table we can read the error name, the affected manifest URL, license acquisition URL and user agent. This information is already useful. Most importantly, we have learnt from the error name that it resulted from a malformed license request to the DRM server.
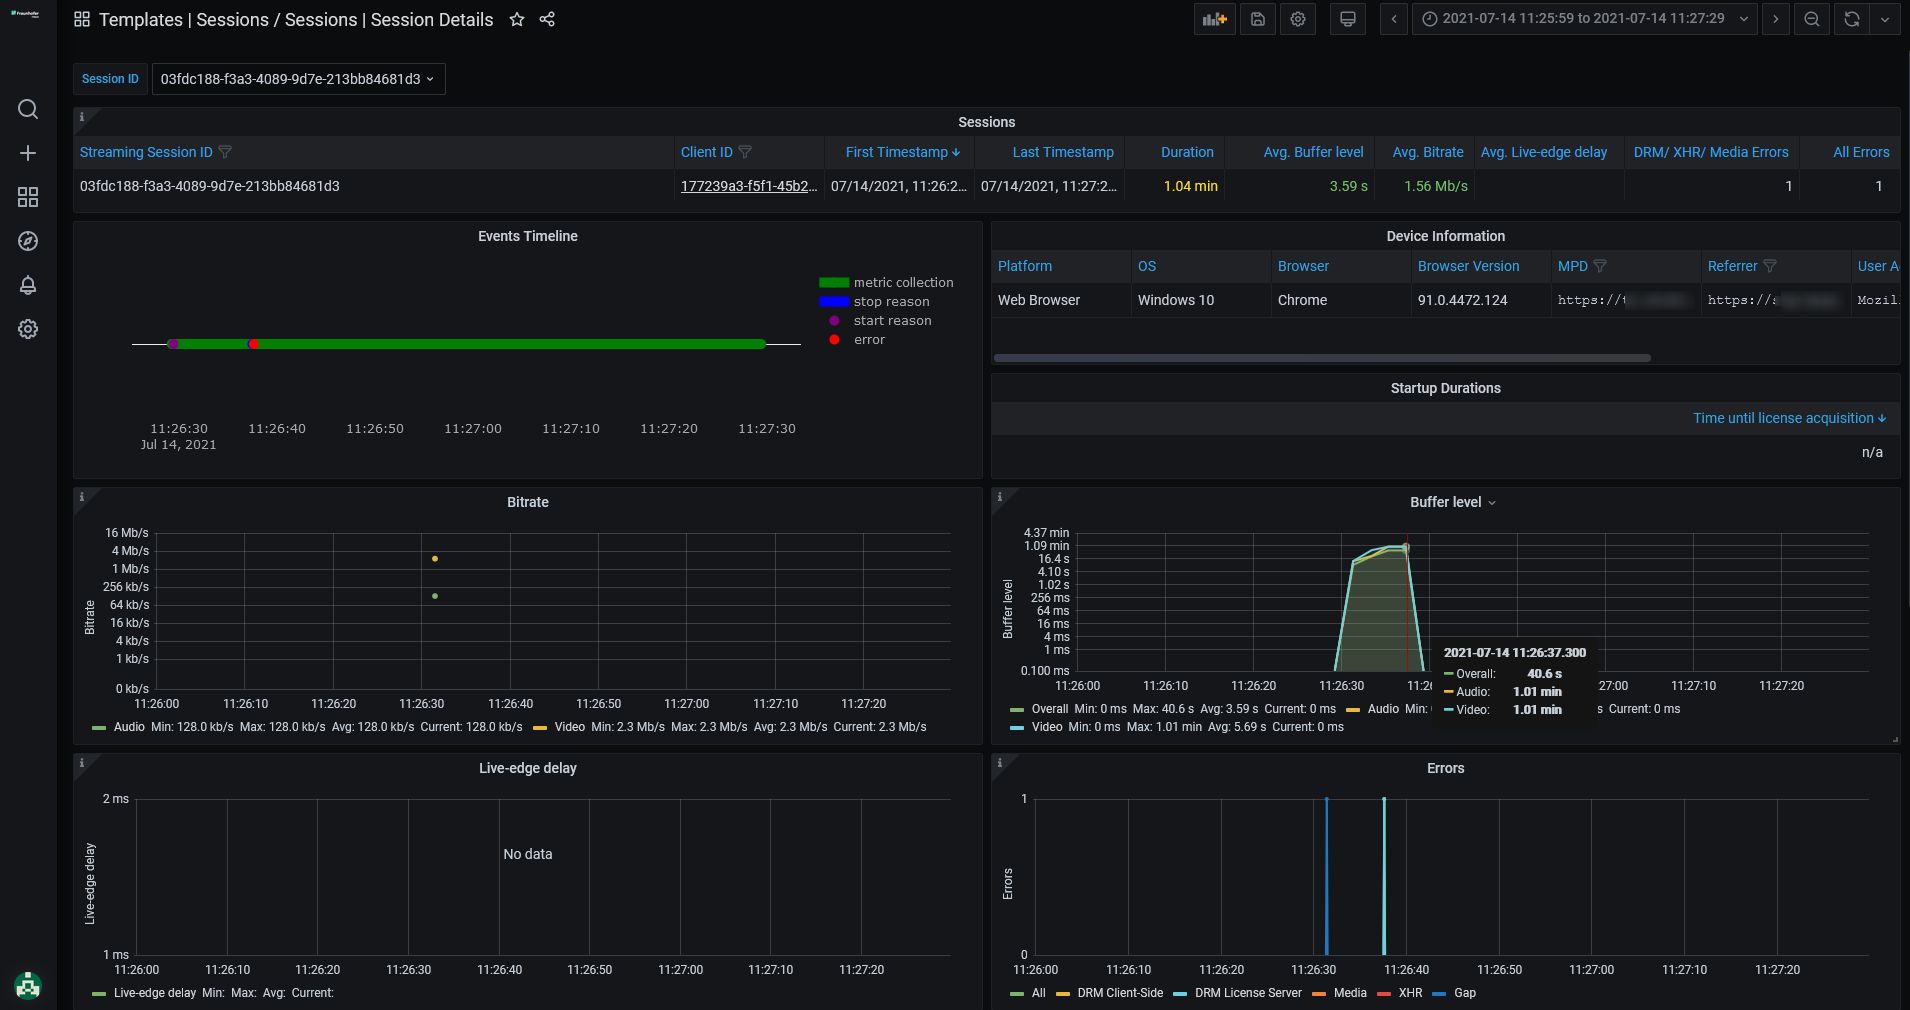
If we want to take a closer look at how the error affected the streaming session, we can click on the streaming session ID to navigate to the Session Details page. As expected in the case of a DRM error, we can observe that the error was thrown at the beginning of the session and that the session never started streaming (no startup time and the buffer level collapses immediately after the error was thrown).
Upon discovering that an error was related to DRM license acquisition, some users jump to the conclusion that there is a problem with the manifest URL but this is very rare. It is far more likely that the acquisition problem has to do with the streaming client who is making the DRM request. It might be that the client is streaming from a older device with compatibility problems or maybe there was a browser update which is causing issues… To find out, let’s check the DRM License-Server error table.
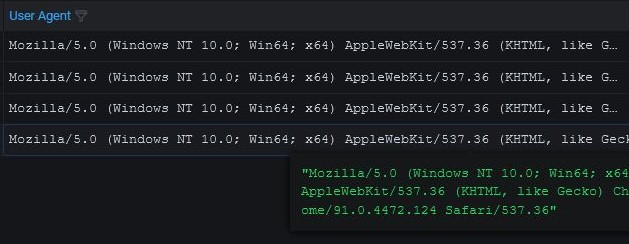
From the name of the error, we know we are dealing with a DRM license error, so we can open the DRM License-Server table as opposed to the general DRM error table we previously checked. By using a column filter, we limit our search to the specific error name we are investigating. There are only four sessions in the last 24 hours with this error name, including ours (marked in red).
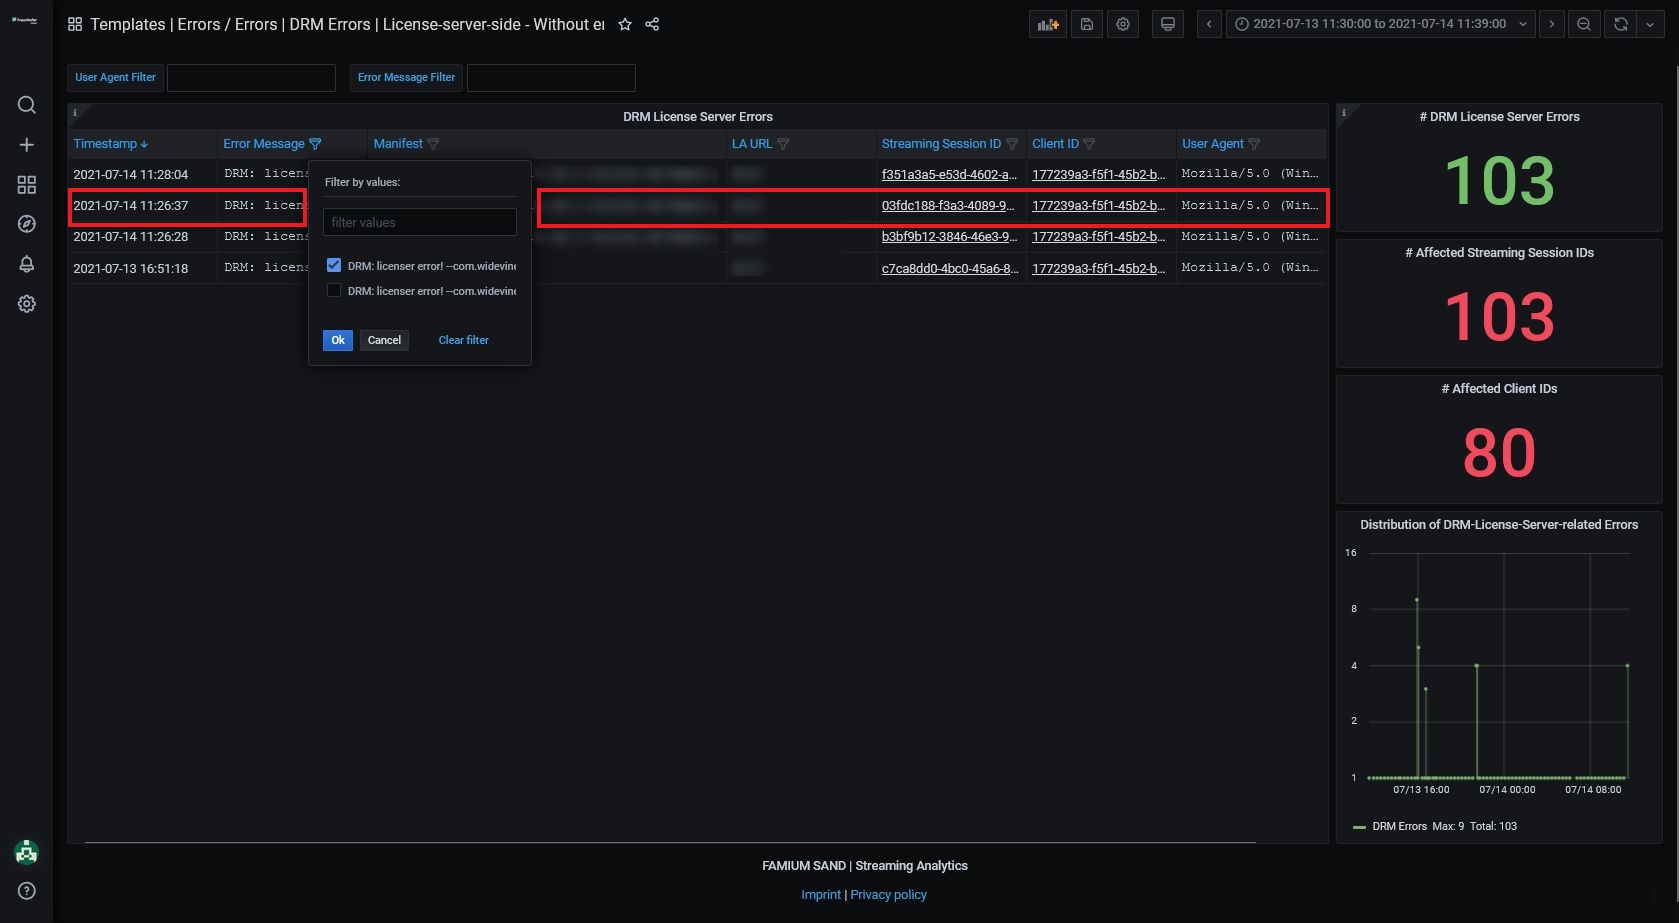
Hovering over the user agent column displays the entire user agent. It turns out that they are all identical. As only four sessions with the same user agent are affected by the error, the error is not systemic. We cannot know exactly what triggered it but at least we have confirmed that in this case it is not a serious problem.
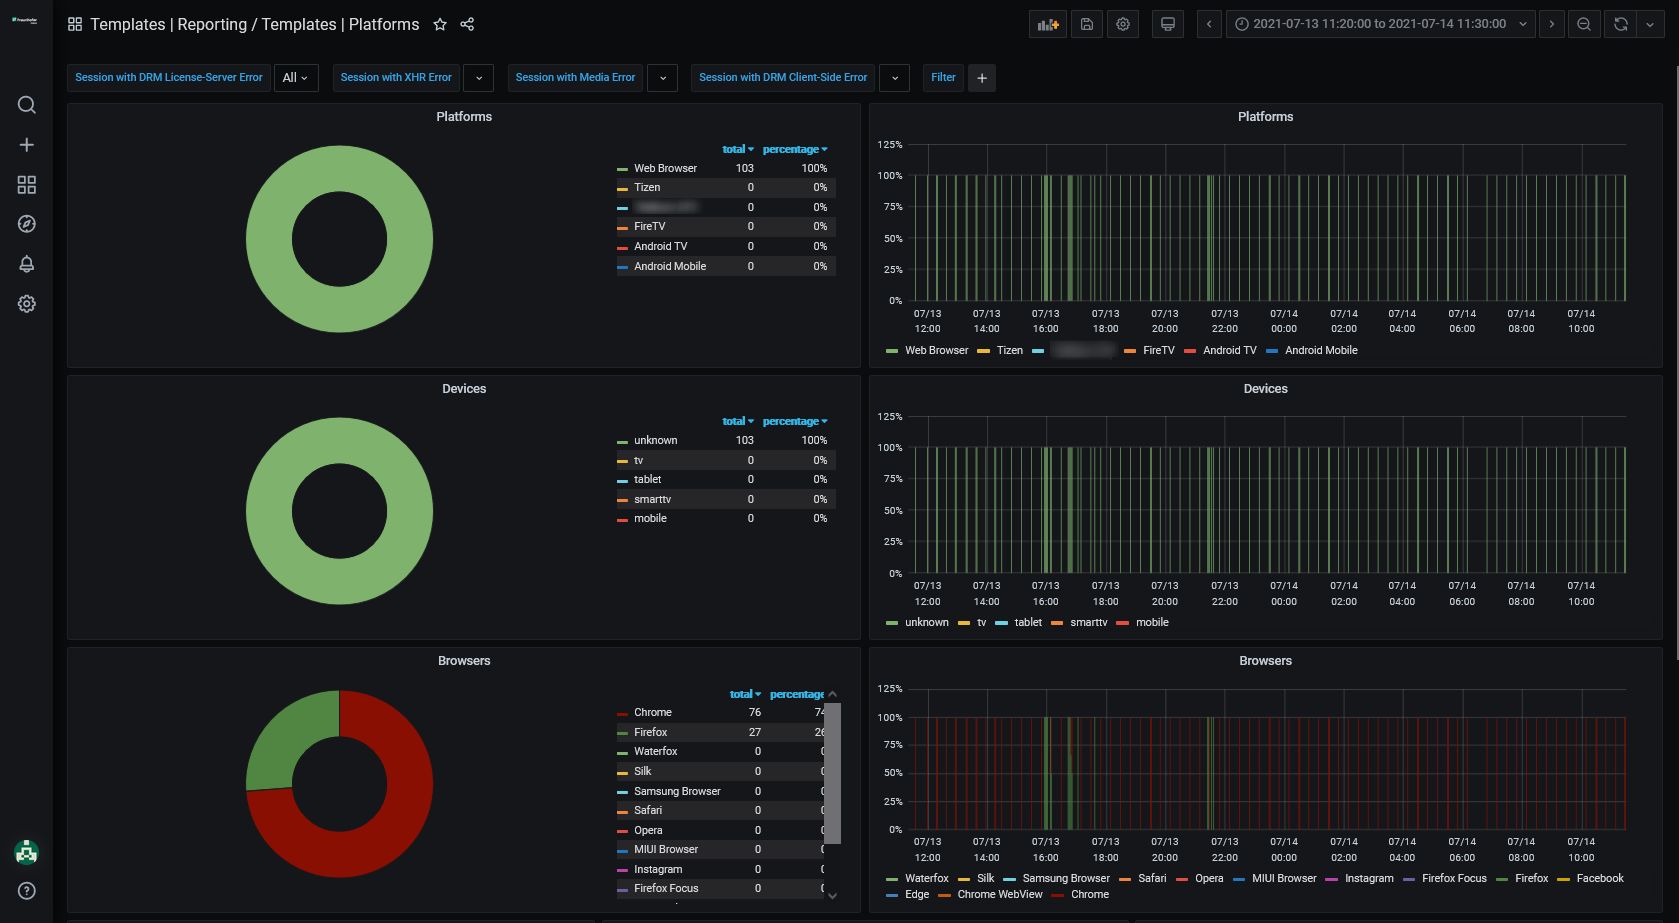
Tip: A manual check was possible because the number of affected sessions was small. Had there been many sessions, it would be advisable to check the Platforms dashboard. The Platforms dashboard shows a breakdown of the platforms, devices and browsers used to stream and we can use filters to limit our search to sessions with DRM, HTTP or Media errors. The information displayed is not as fine-grained as that provided in the user agent column of table dashboards but the Platforms dashboard nevertheless gives a useful overview.
Summary
In this section, we showed how to debug an error in real-time using the Monitoring dashboard and the tabular dashboards.
3. Start with the Session Overview Dashboard
In the third and final section of this blog post, we will use the Session Overview dashboard as a starting point for error debugging.
The Session Overview dashboard is a table listing all session and some of their key metrics. By sorting columns into ascending order, problematic sessions can quickly be identified. For example, sorting the DRM/ HTTP/ Media Errors column or All Errors column quickly draws attention to sessions that have many errors.
Another good way to find errors is by sorting the Duration column or Bitrate column. This is because most errors occur during the first 60 seconds of a streaming session and serious errors like DRM errors are thrown at the beginning of a streaming session. If you see sessions that are very short, they likely encountered errors. Furthermore, problematic sessions usually have fluctuating bitrates or no bitrates at all.

Session 81ae72c3-ee9f-4f5b-b797-a9f9db5c4bf0, for example, only lasted 18 seconds, has no bitrate and reports one error. By clicking on the session ID we navigate to the Sessions Details page where we observe that the error was a client-side DRM error. The error name is very revealing. It suggests that the client did not have the right to access the content. This in turn explains why there is no start up time, buffer level or bitrate.

Summary
In this section, we showed how to find problematic sessions using the Sessions Overview dashboard. By sorting the Error columns, we can quickly find sessions that have many errors. Other indicators of problematic sessions are very short durations and low bitrates. Once a problematic session has been found, it can be debugged by navigating directly to the Session Details dashboard via the Streaming Session ID link.
Conclusion
In this two-part blog post, we walked through three debugging examples. We identified the errors and used the information from the dashboards to understand what caused them. After reading Parts 1 and 2, it should be clear why we say SAND has a “debugging-oriented design” and you should feel more confident using the tool to investigate errors.
If you still find debugging tricky, don’t be discouraged. Understanding errors can be hard and requires practice. That’s why we are committed to always improving the debugging capabilities of FAMIUM SAND. In fact, we are currently developing ways to leverage artificial intelligence to detect errors and predict their causes. We are also working on incorporating an alerting function into the tool so that dashboard users don’t need to hunt for errors anymore. Instead, users will be automatically notified if a serious error occurs.
The goal is to make the debugging process even easier and more effective for our customers. Sound good? Then stay tuned because updates on the topic are coming soon!