Overview
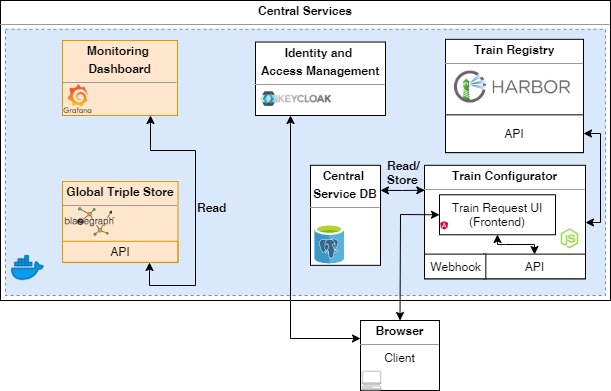
The CS provides several monitoring and management services, e.g., to define and execute the Station sequence, to secure intermediate and final results generated by the Trains, and to provide interfaces to the repositories of each operating partner in our architecture.
In the figure above, we depicted a general workflow of our CS. First, it covers a so-called Train Class Repository. Researchers and scientists are able to propose and store their developed analytic algorithms containerised in a base image, which is termed Train Class, and make them available to others (see Train Creation Wizard). If the researcher requests an analytical job and defines a sequence of Stations to be visited, the CS replicates the base image and stores it in the repository of the first positioned Station in the sequence. After the Station pulled, executed, and pushed the Train back, the CS copies the new Train image into two repositories: The User Repository representing the execution history and the repository of the next Station in the sequence for the subsequent Train execution. The CS is developed as a REST web service running on an Apache Web Server. This service utilise APIs and Webhooks to trigger the above-mentioned procedures, e.g., Train pulled, Train pushed or Train rejected.
Components

As central Train Repository, we use Harbor to store the Train images and to provide role-based and access-controlled (RBAC) repositories.
The access for scientists and researchers is controlled by an identity and access management (IAM) component on the central unit. As IAM, we use the open-source software Keykloak to manage user accounts and access authorisations for components of our central services.
We use a BlazeGraph server to store information about transactions and information emitted by the Train itself. The information is formatted according to Semantic Web standards and our developed Metadata Schema for our components. The BlazeGraph database enables transparency and poses an opportunity for further optimisations.

We use Grafana, an open source visual analytics platform, for the creation of user-friendly and customisable monitoring dashboards by GrafanaLabs. It supports various data sources for the visualisation of important information about the user’s algorithm or in-depth information about the Station(s).